Introduction to Geographic Data Formats!
PLEASE interrupt if you have questions!
First things first: What is geographic data?
Geographic data represents things that have a location.
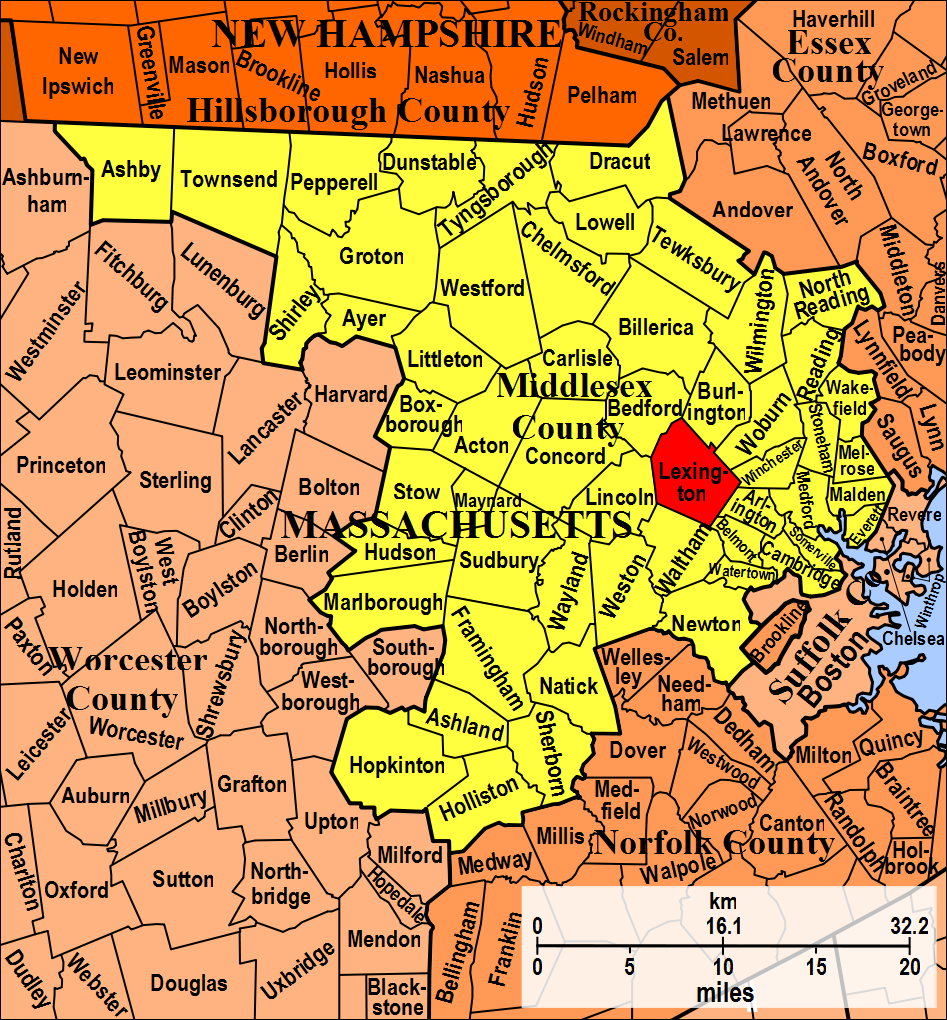
This can include physical things like roads, rivers, and cities.
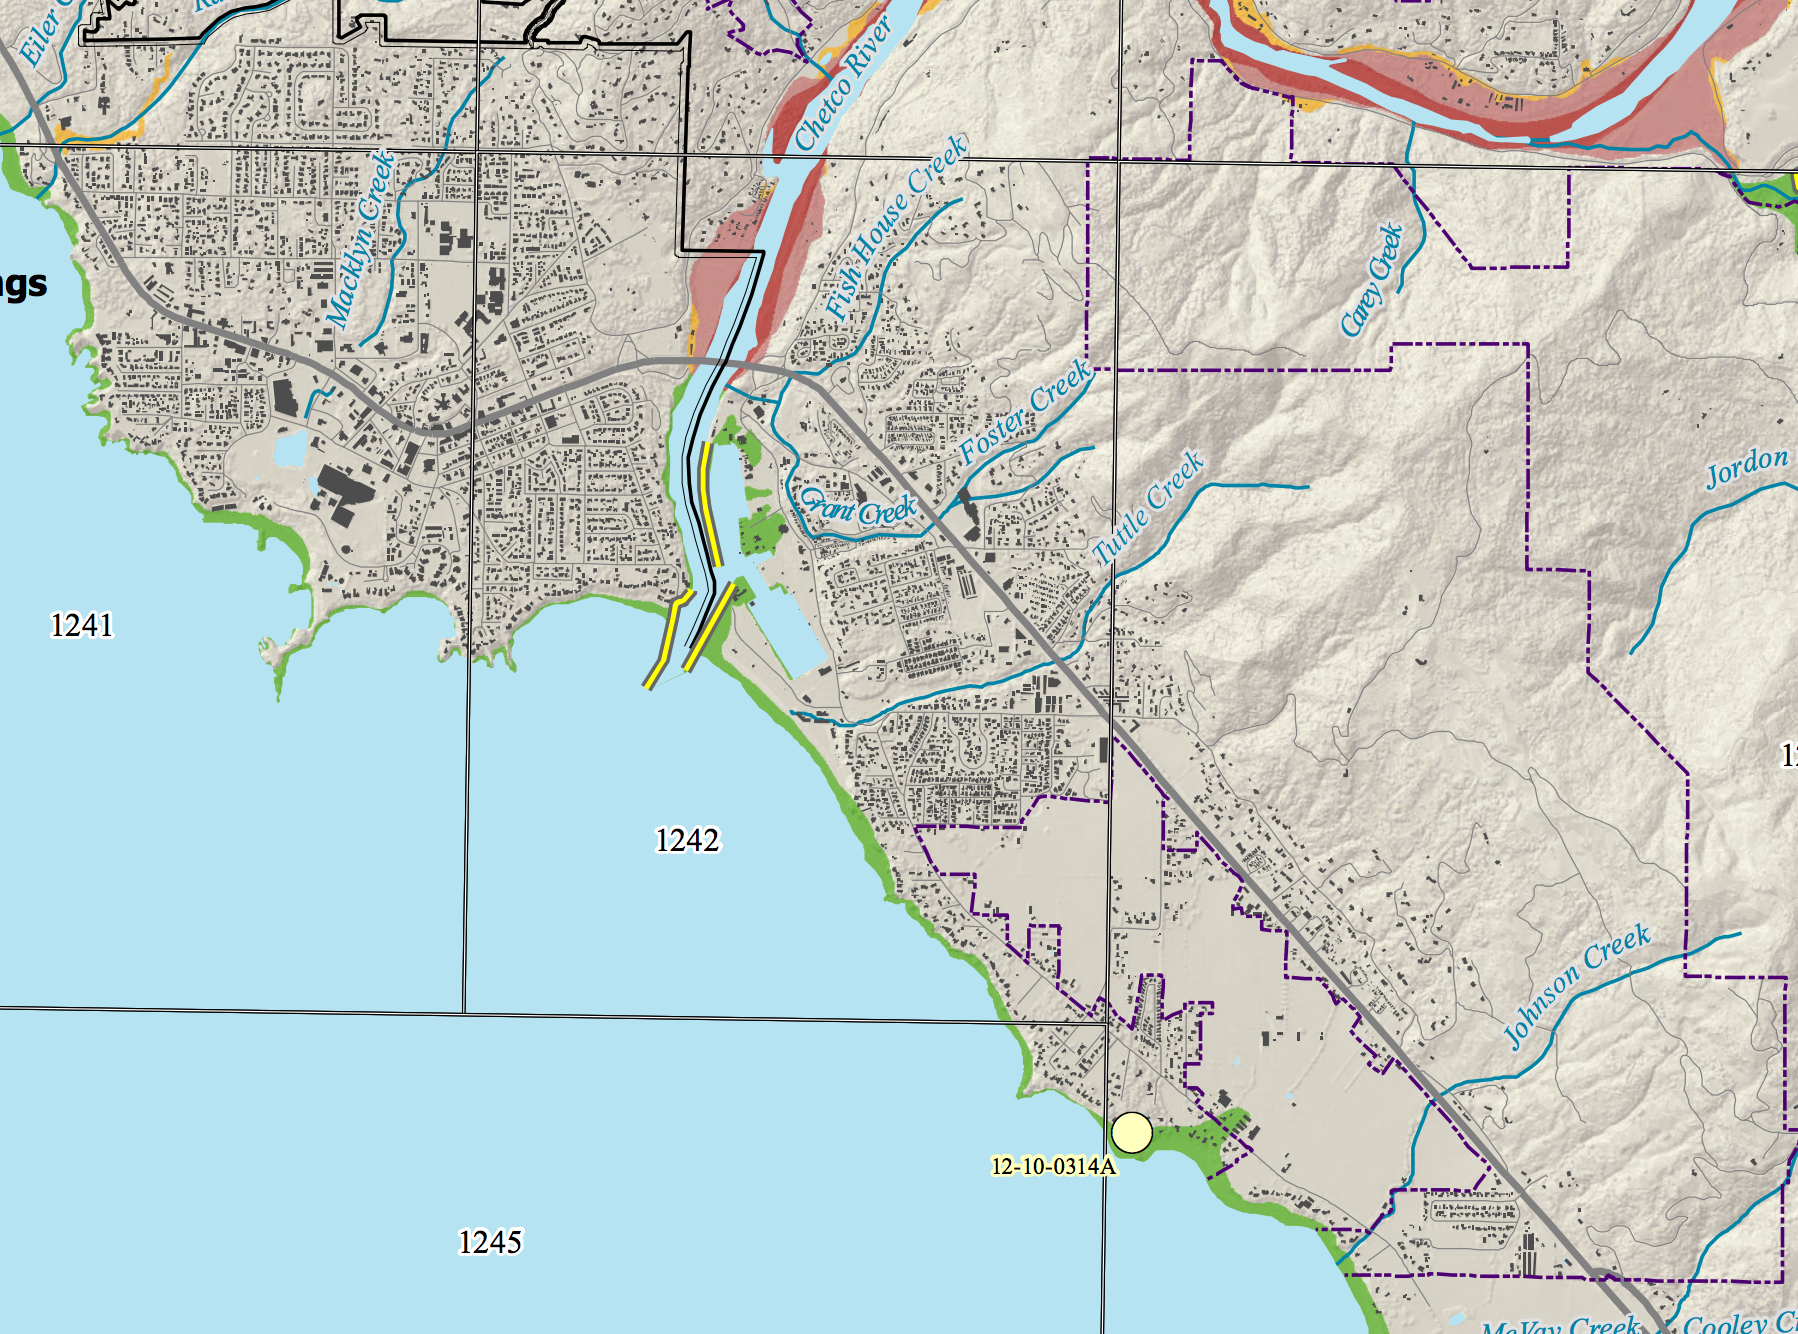
OMG flood zones
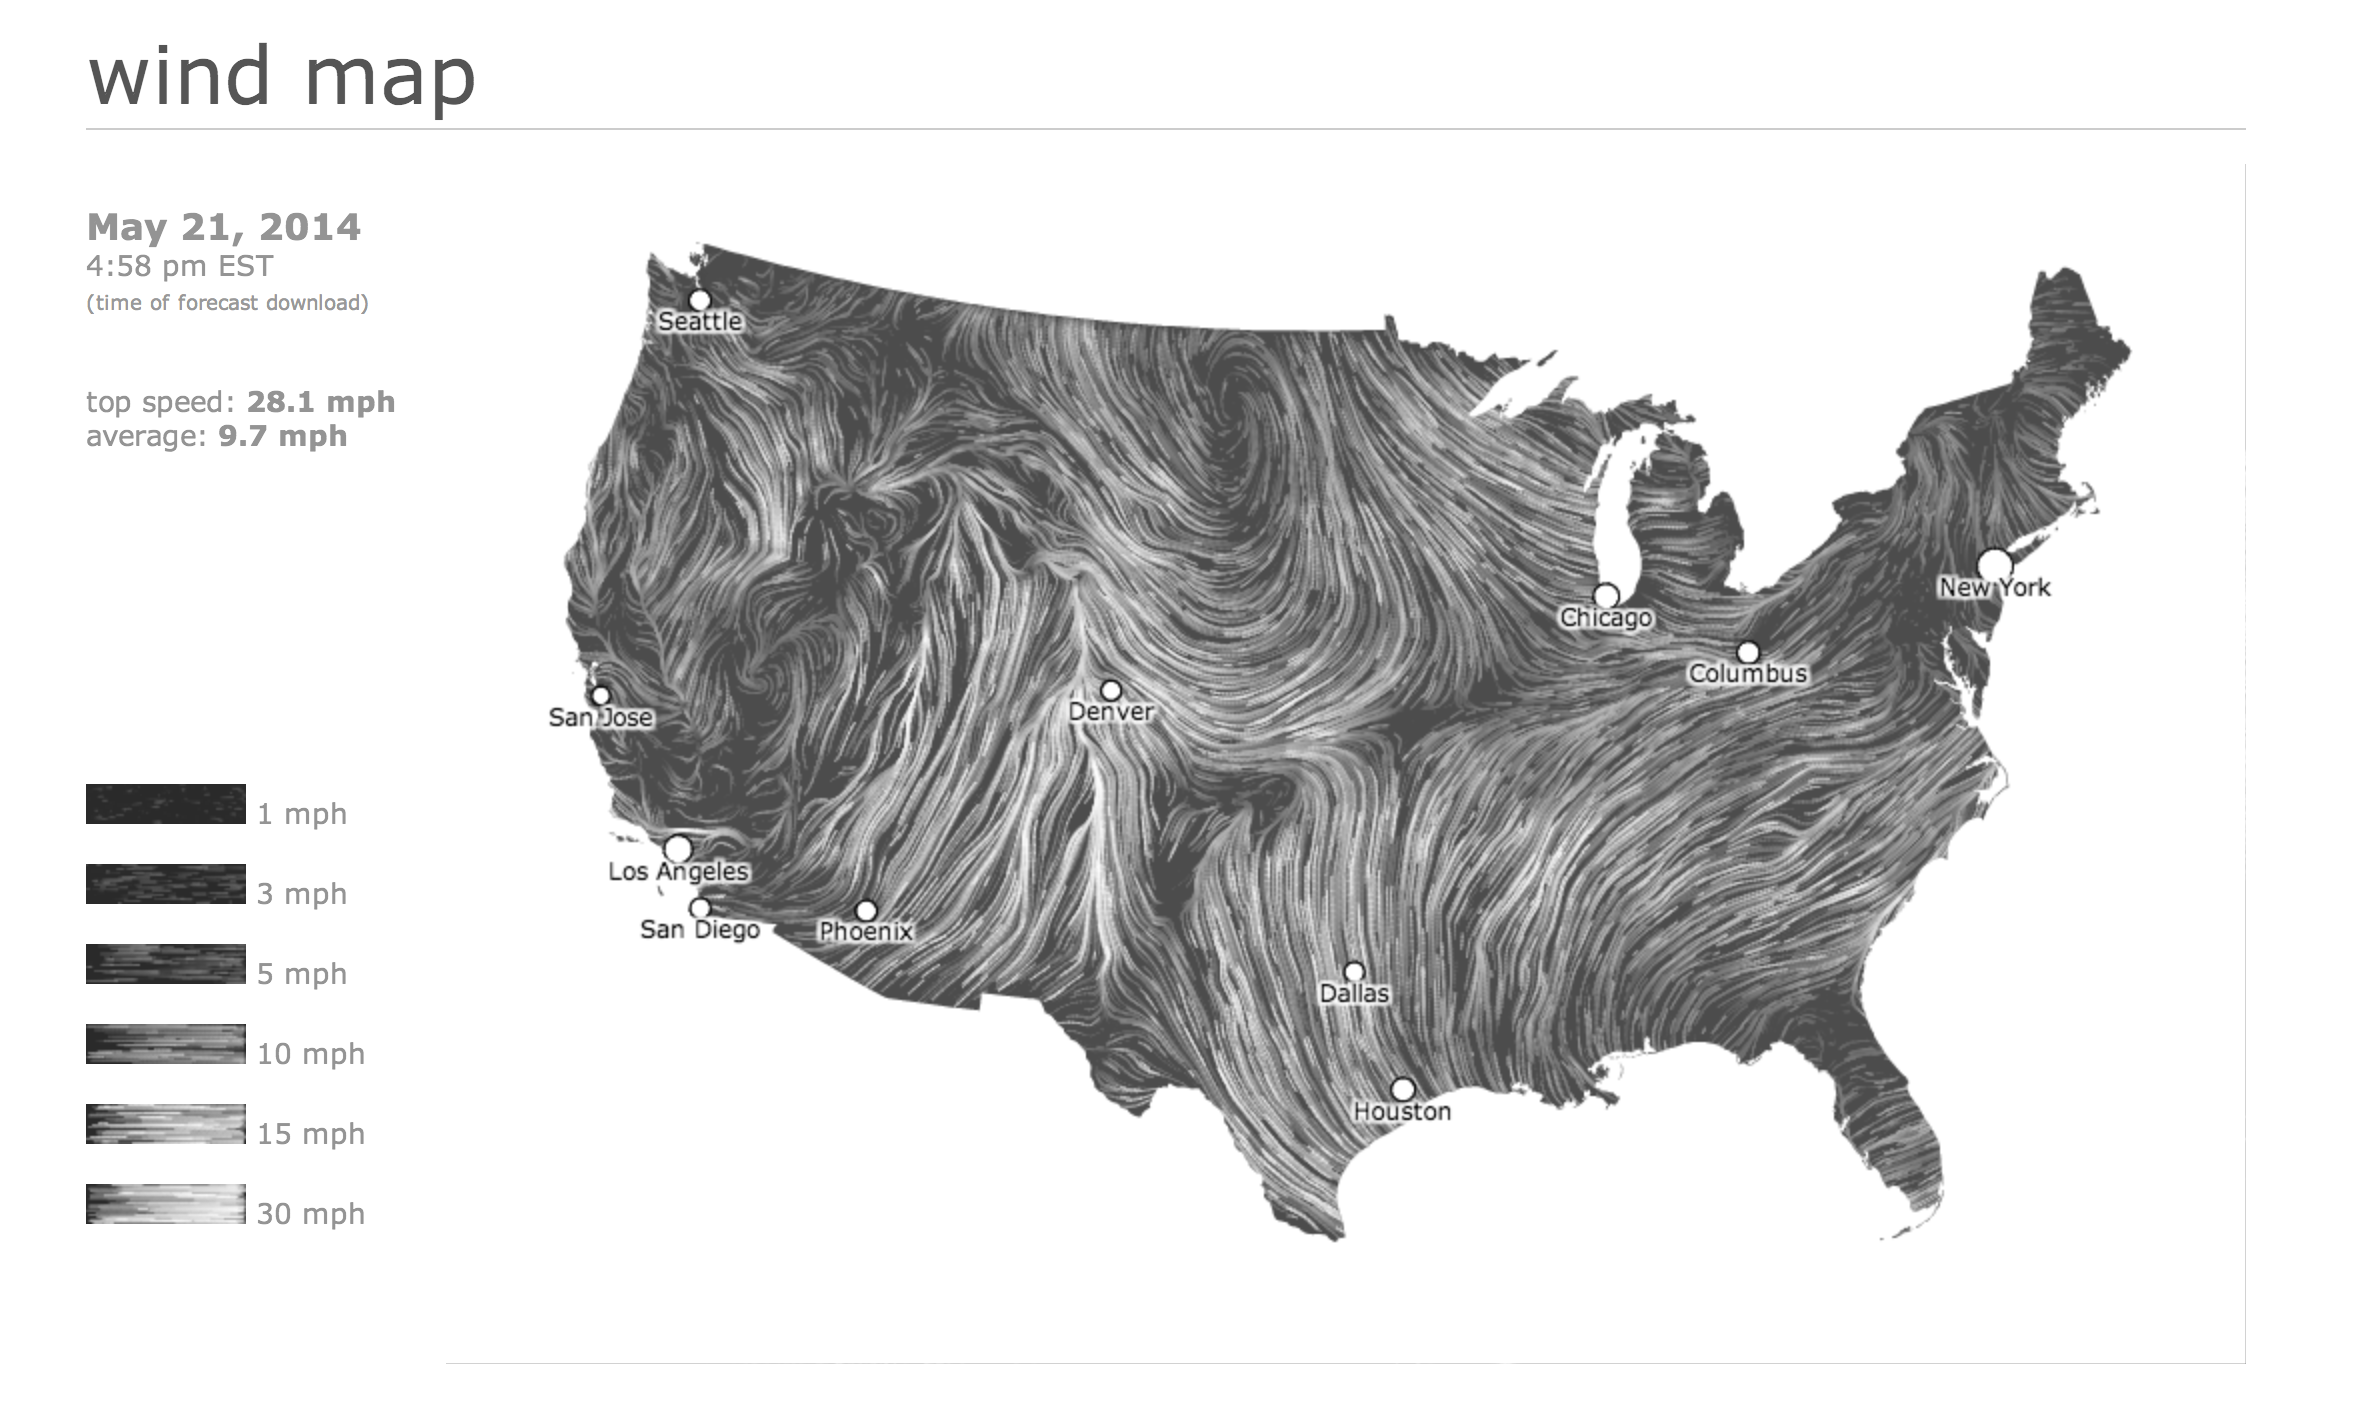
It can also include ephemeral phenomena, like rainfall rates, 911 calls, and weather patterns.
OMG annual precipitation
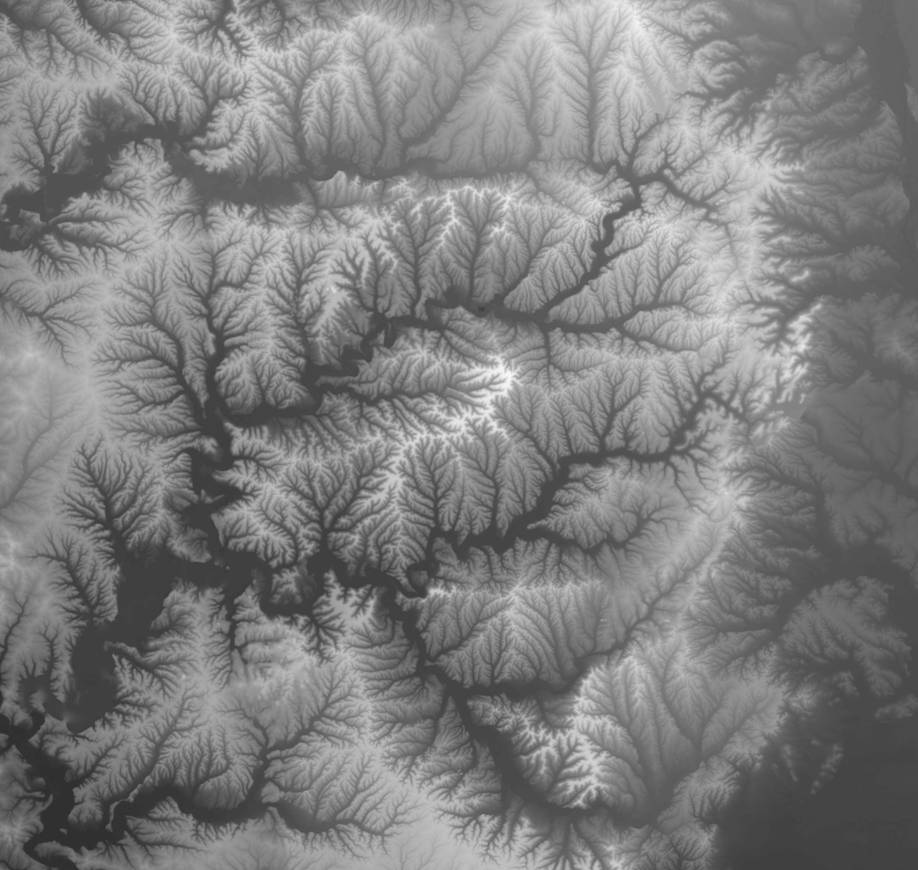
Geographic data can also capture nuances of locations, like the degree of slope at a specific location on the side of a mountain.
How do we use geographic data?
Typically, geographic data is used for two things: visualization and analysis.
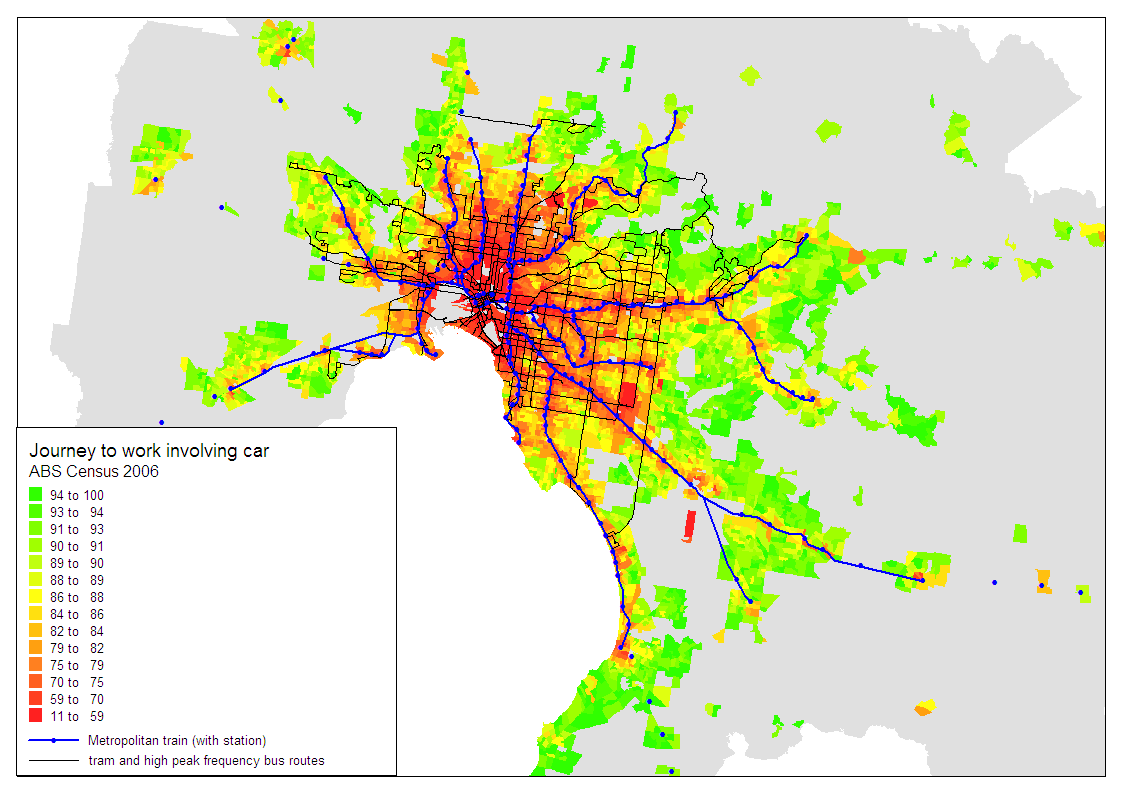
Analysis!
Visualization!
It is often used for both!
So pretty.
There are many different types of geographic data, used by many different types of software, web tools, and libraries, for many different use cases.
Fortunately, we have many resources at our disposal to transform data from one type to another.
Let's first talk about the types of geographic data and their use cases.
Geographic data typically falls into two camps: raster data and vector data.
Rasters!
Vectors!
I am most often working with vector data, so let's start there.
Vector geo data has three things: geometry, a location, and attribute information.
One
super common geographic data format is the
shapefile.
Shapefile is actually a misnomer: the data format requires three different files to store its core data (plus some optional files).
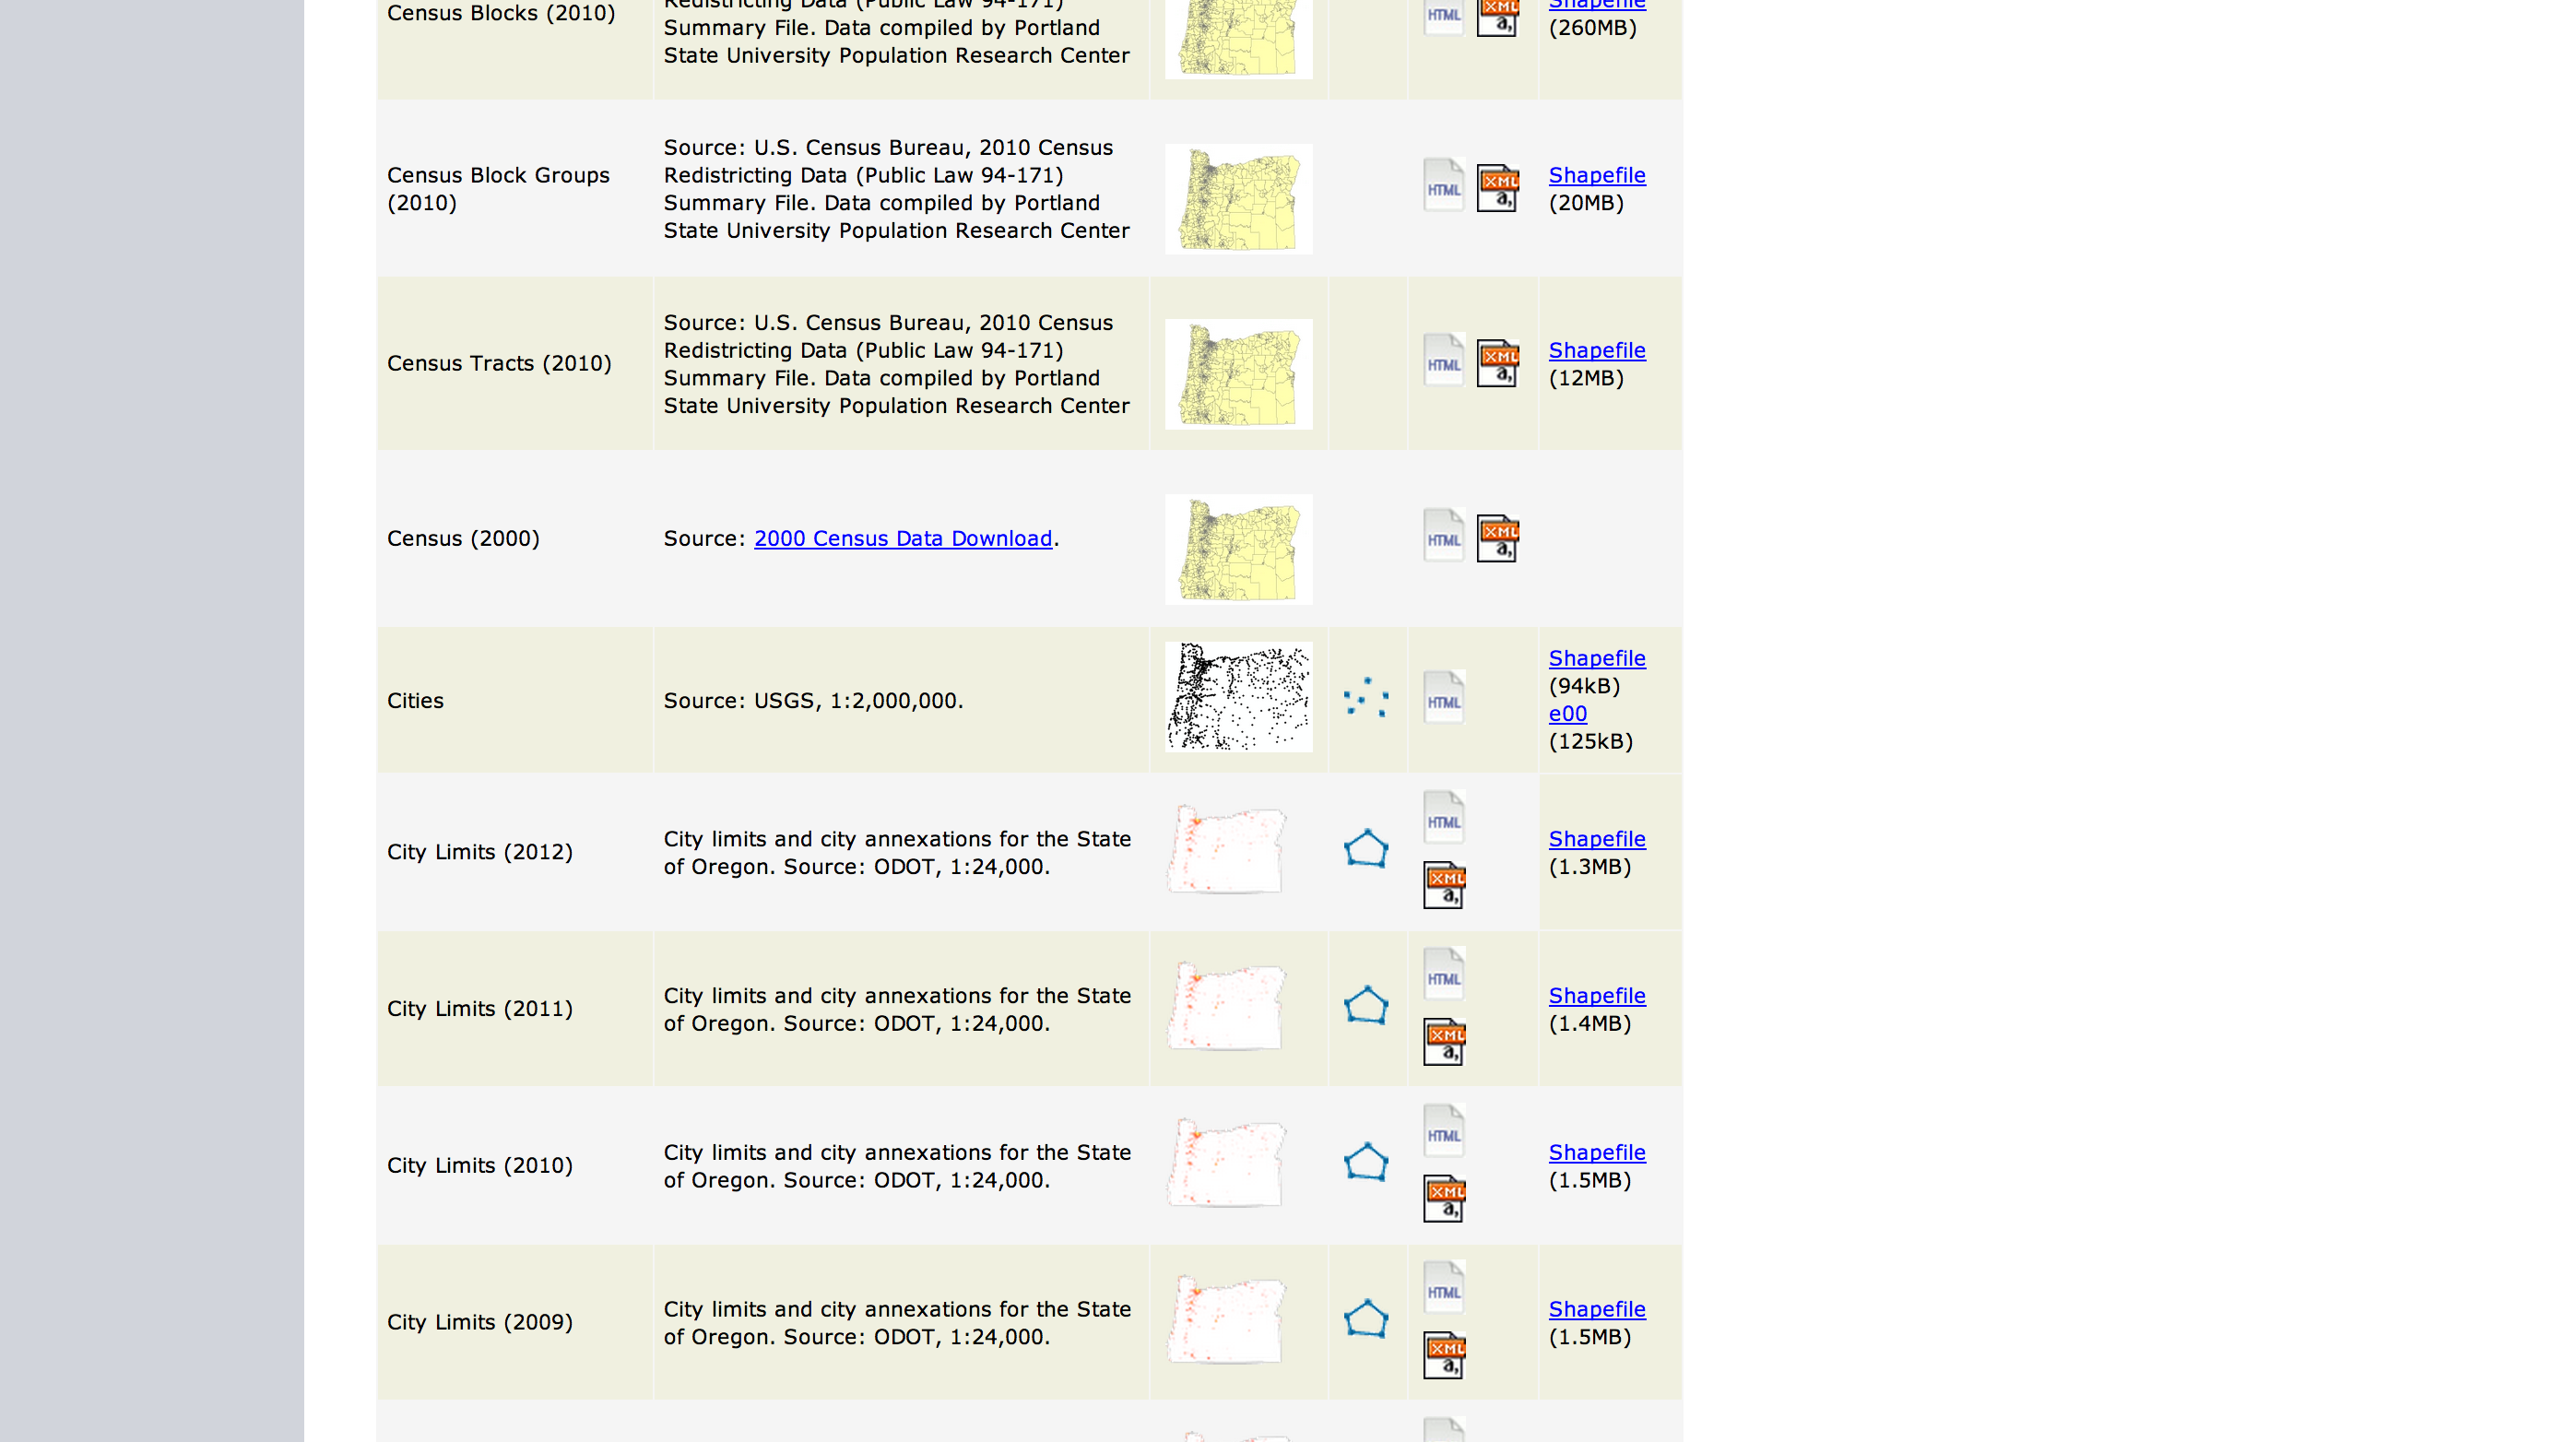
Let's take a look at a shapefile. Head over to
http://bit.ly/orgeo and download the Cities shapefile.
http://bit.ly /orgeo
Clicking the link should have downloaded cities.zip. Extract that to a folder and take a look at the files in it.
There are two files that are unrelated to the shapefile: the PDF file and the HTML file. We can ignore those for now.
There are four other files in the folder: a dbf, a prj, a shp, and a shx.
The three mandatory files are the dbf, the shp, and the shx.
Open up the dbf file in a text editor.
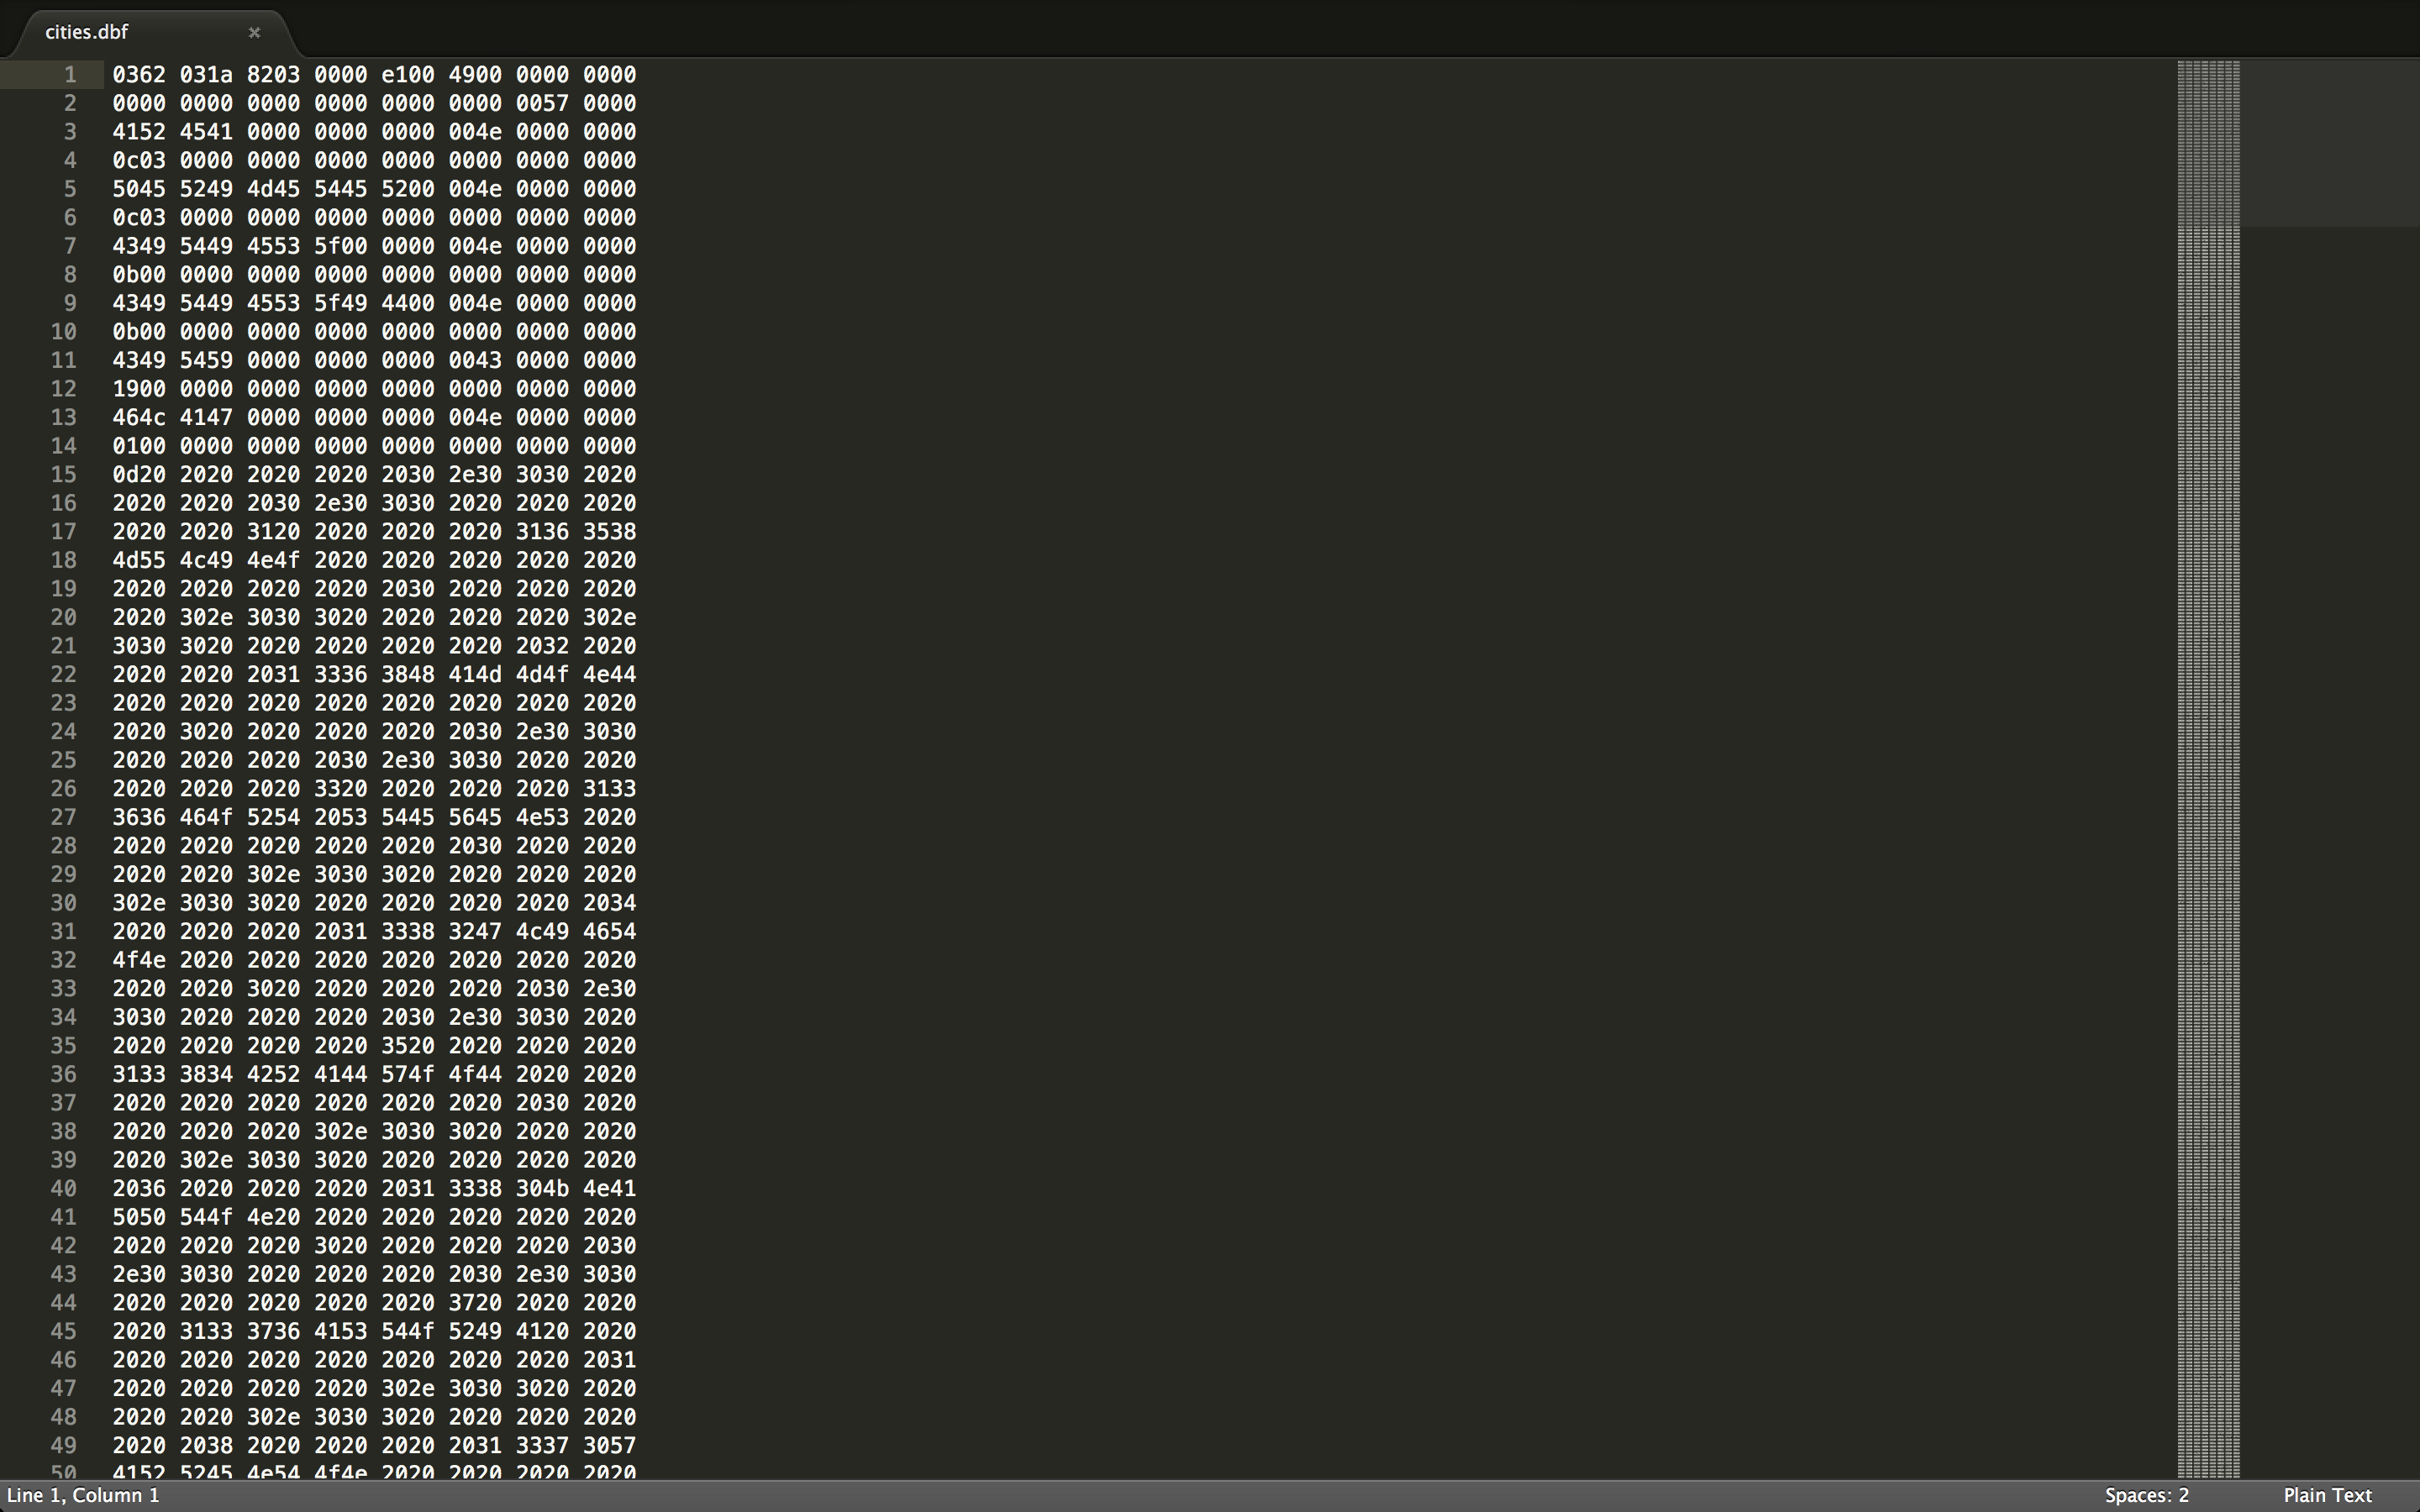
It should look something like this.
The dbf contains the attribute information for the dataset, with different values for each feature.
Now open up the prj file in a text editor.
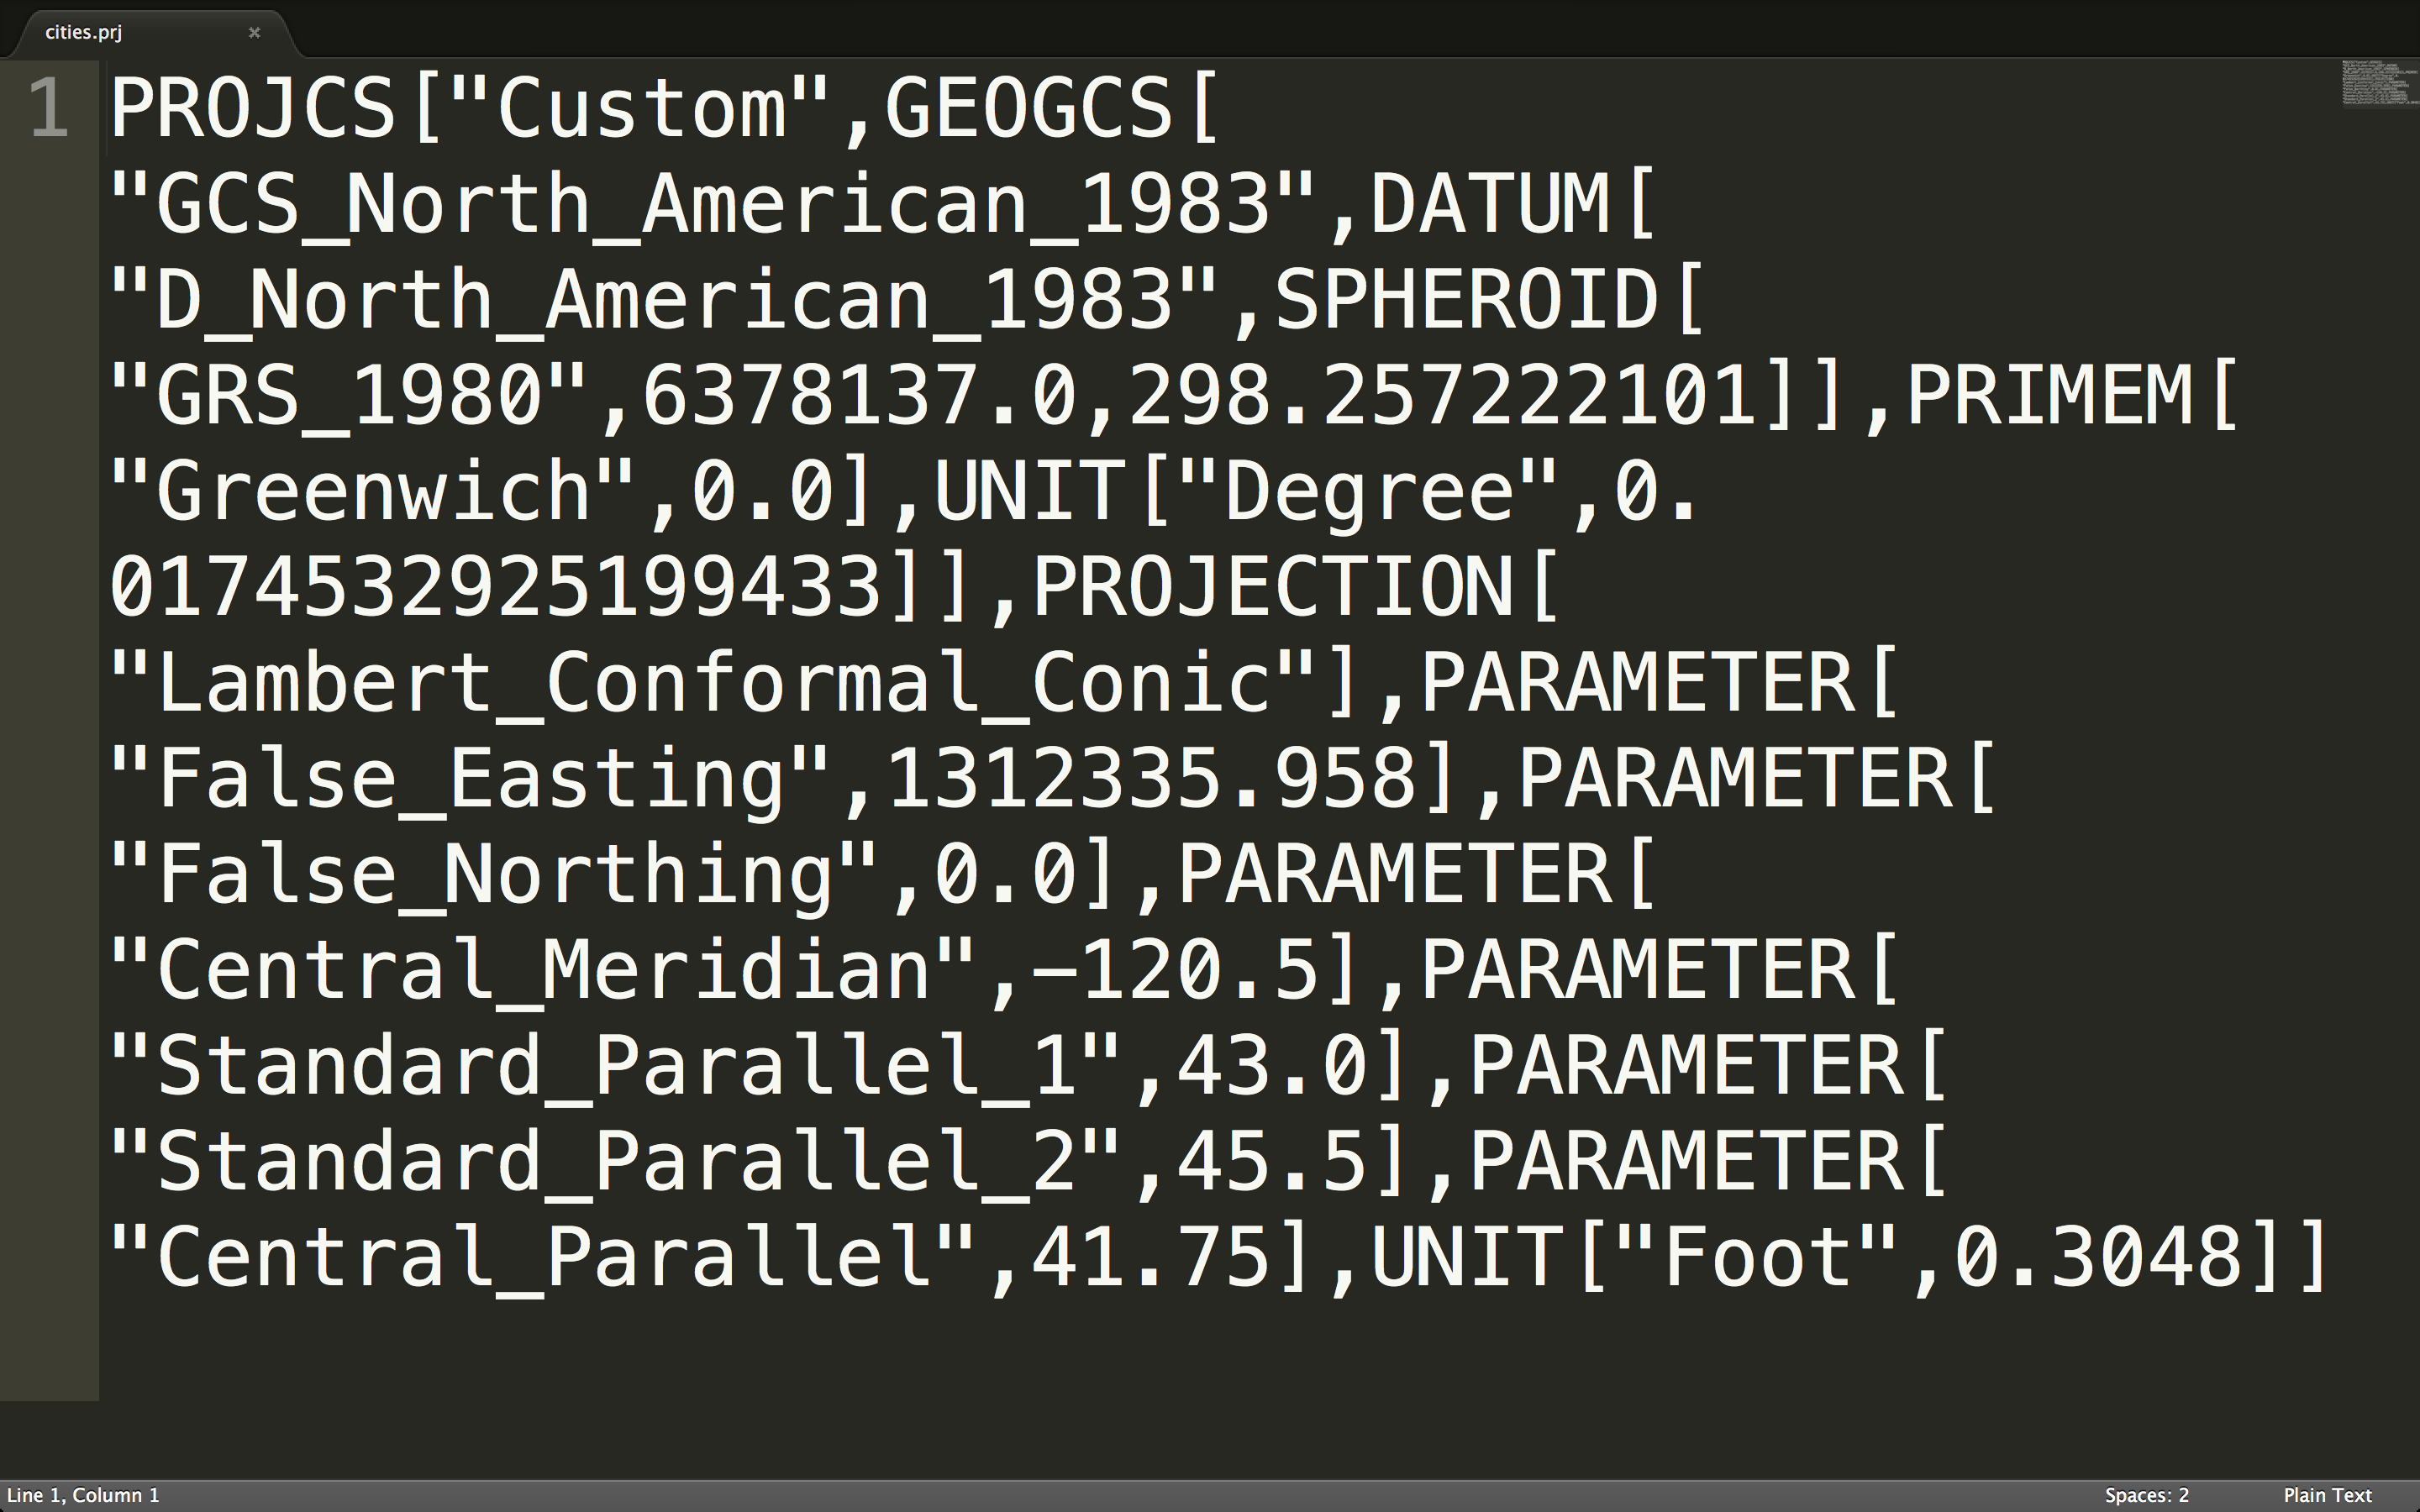
It should look something like this.
The prj contains the projection information for the dataset.
(Projections deserve their own discussion. :-P)
We can skip the shx file. It is an index file to allow quick seeking within the file.
Ah, now to the shp file!
If you have QGIS or ArcGIS installed on your machine, open up the cities.shp file.
(If you don't, just look up here!)
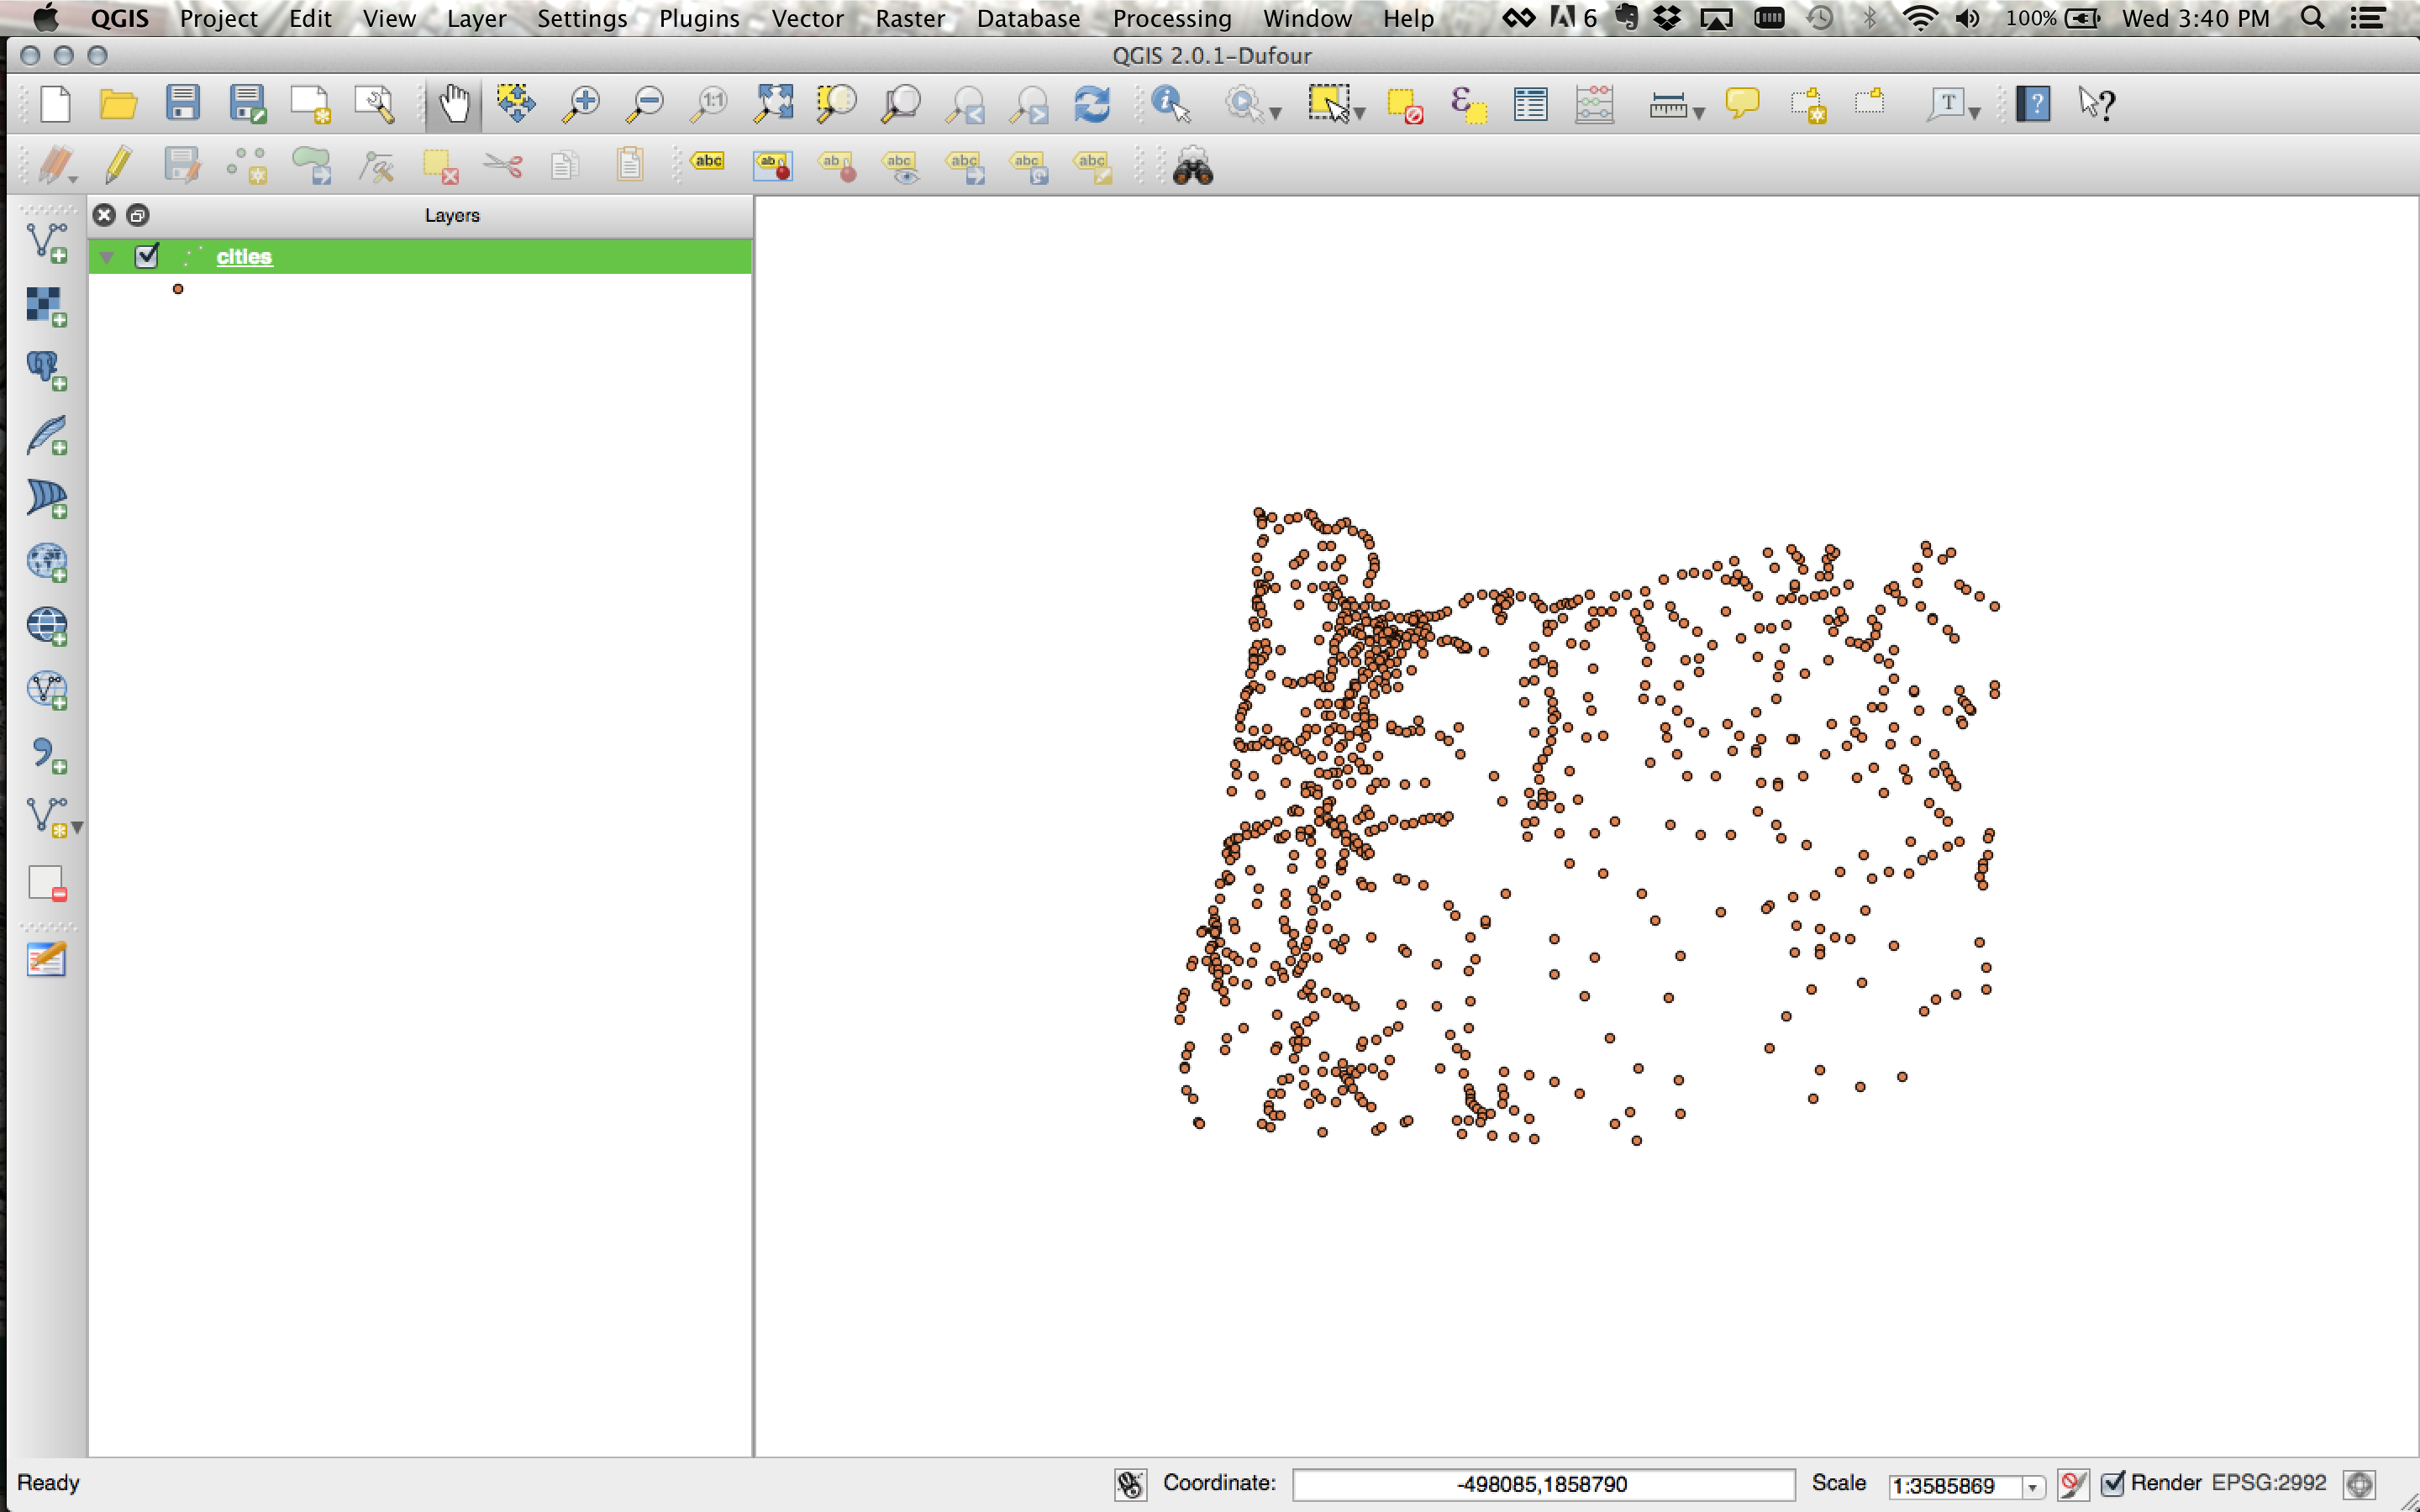
This is what the data looks like.
The shp file contains the dataset's geometry information. (Points, lines, polygons, etc).
Open the attribute table for cities.
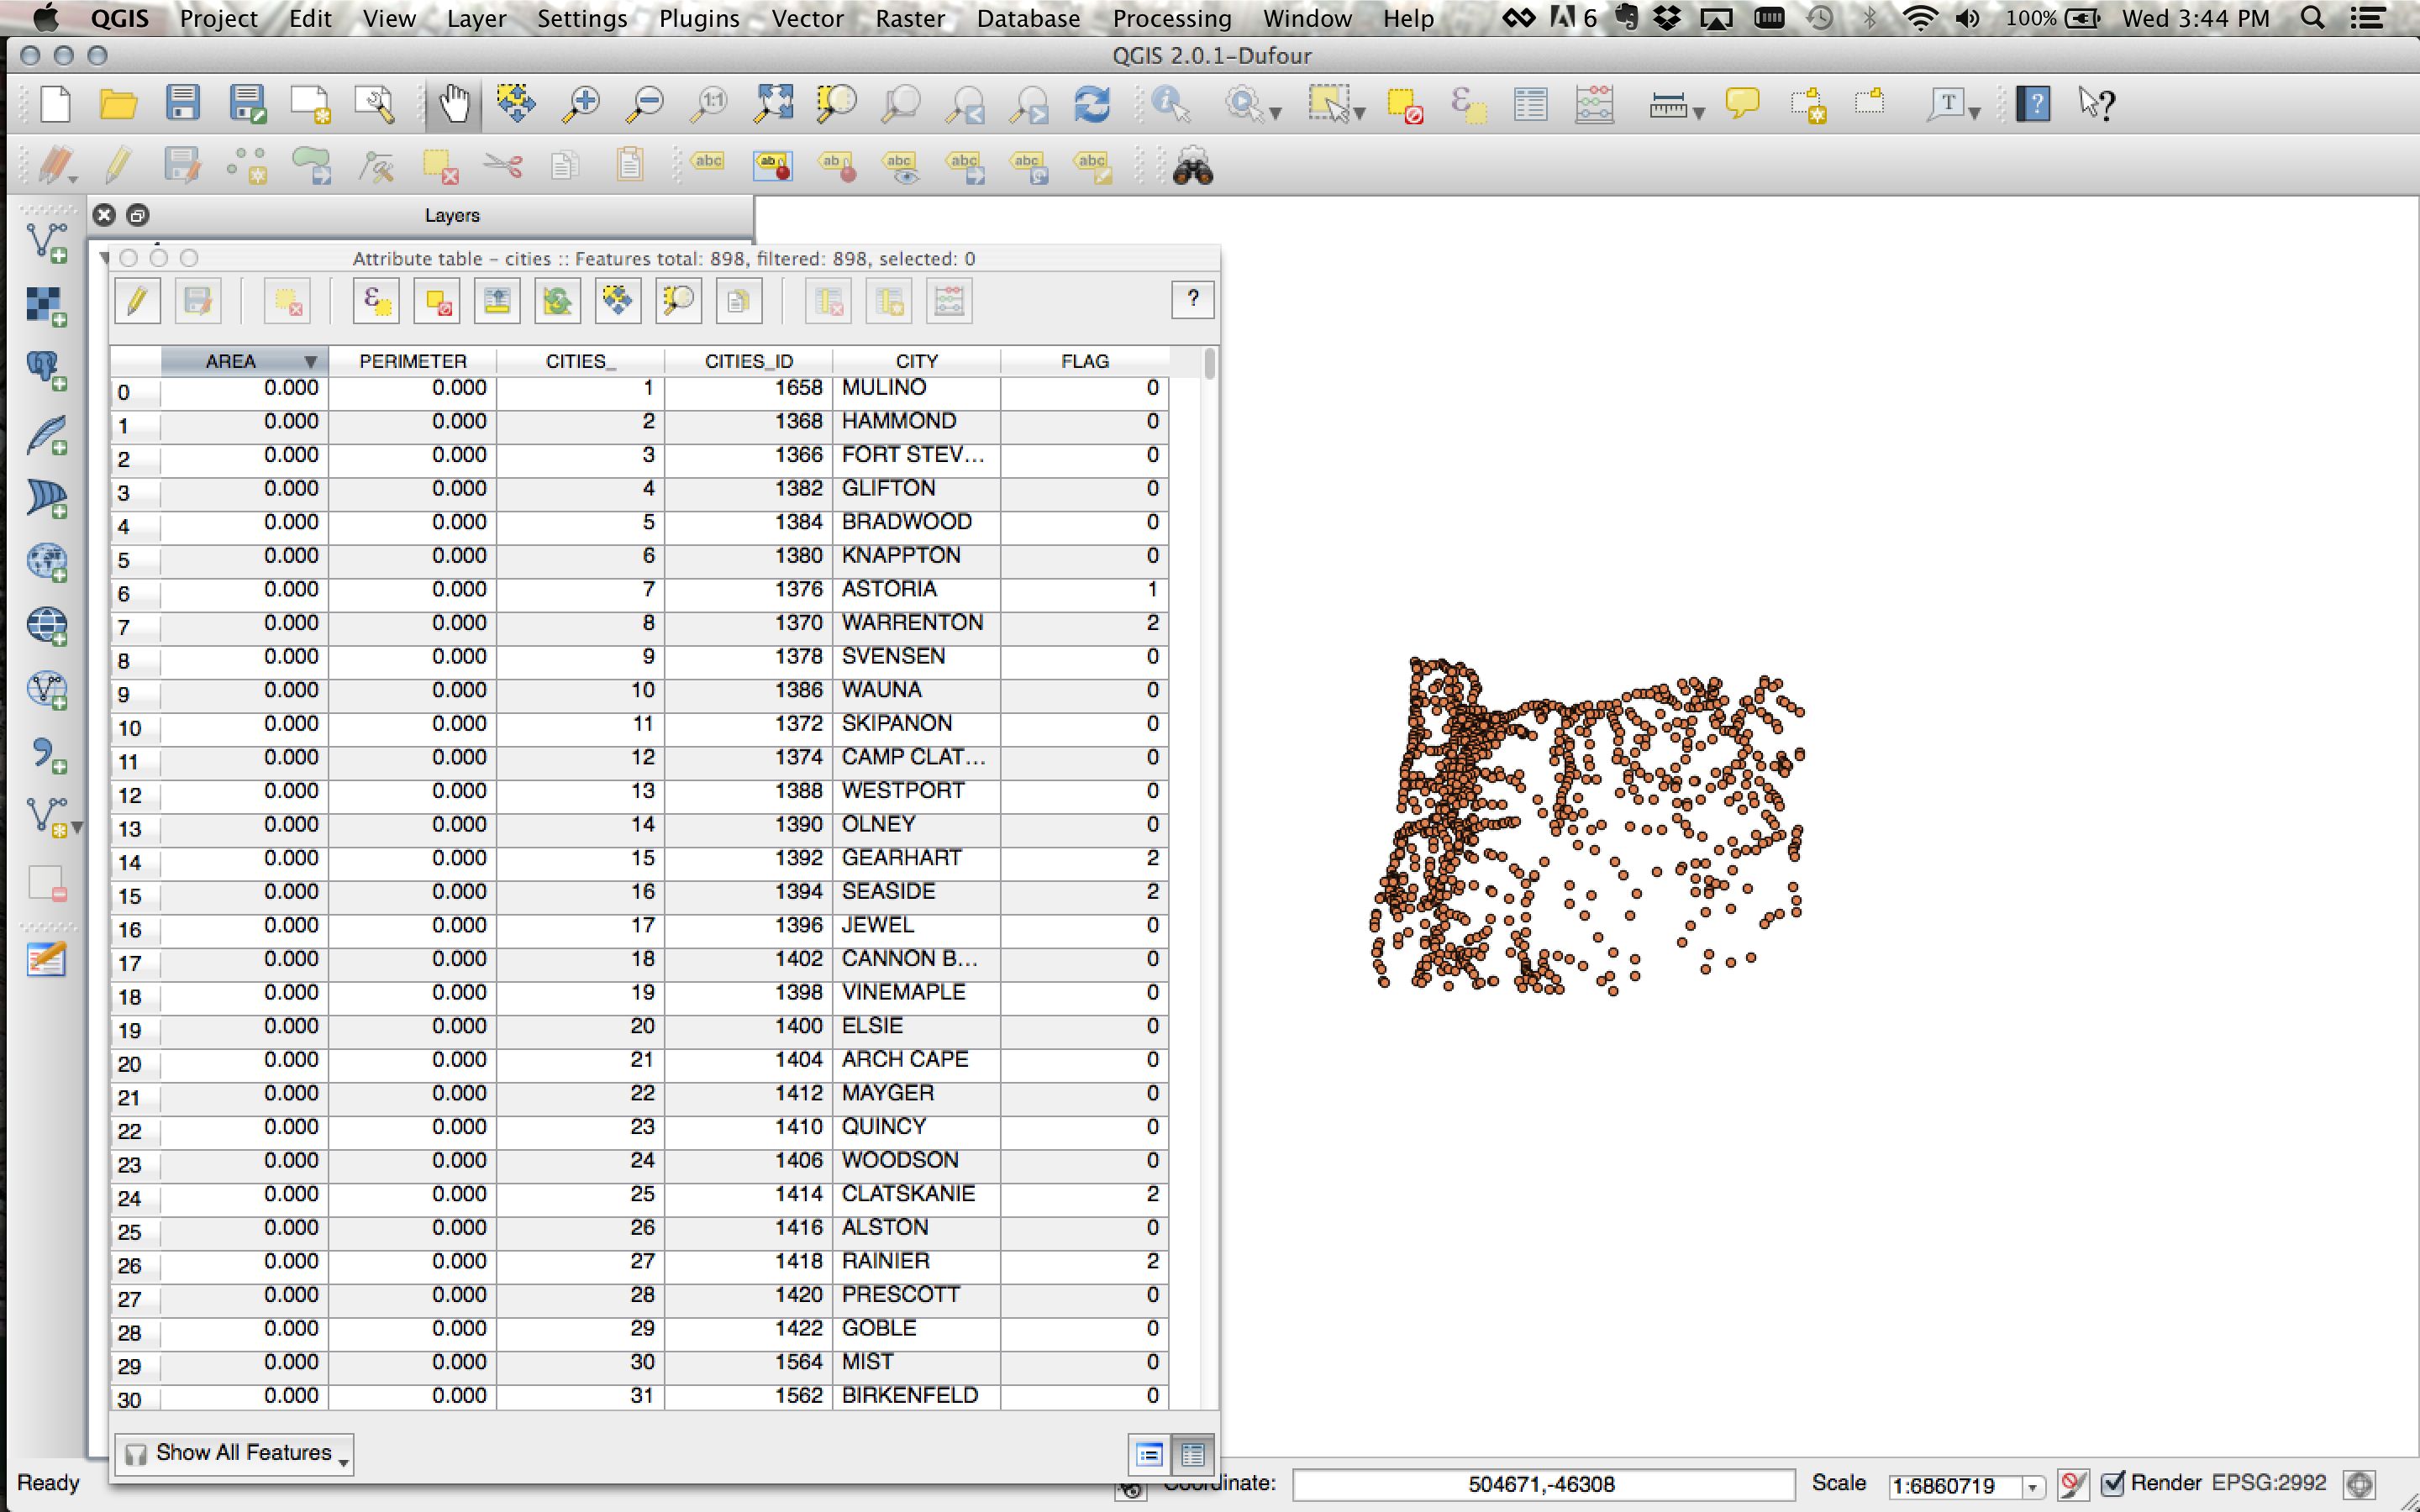
The
dbf file generates this table of information.
Check out the properties of the cities file, and take a look at the projection (or coordinate reference system).
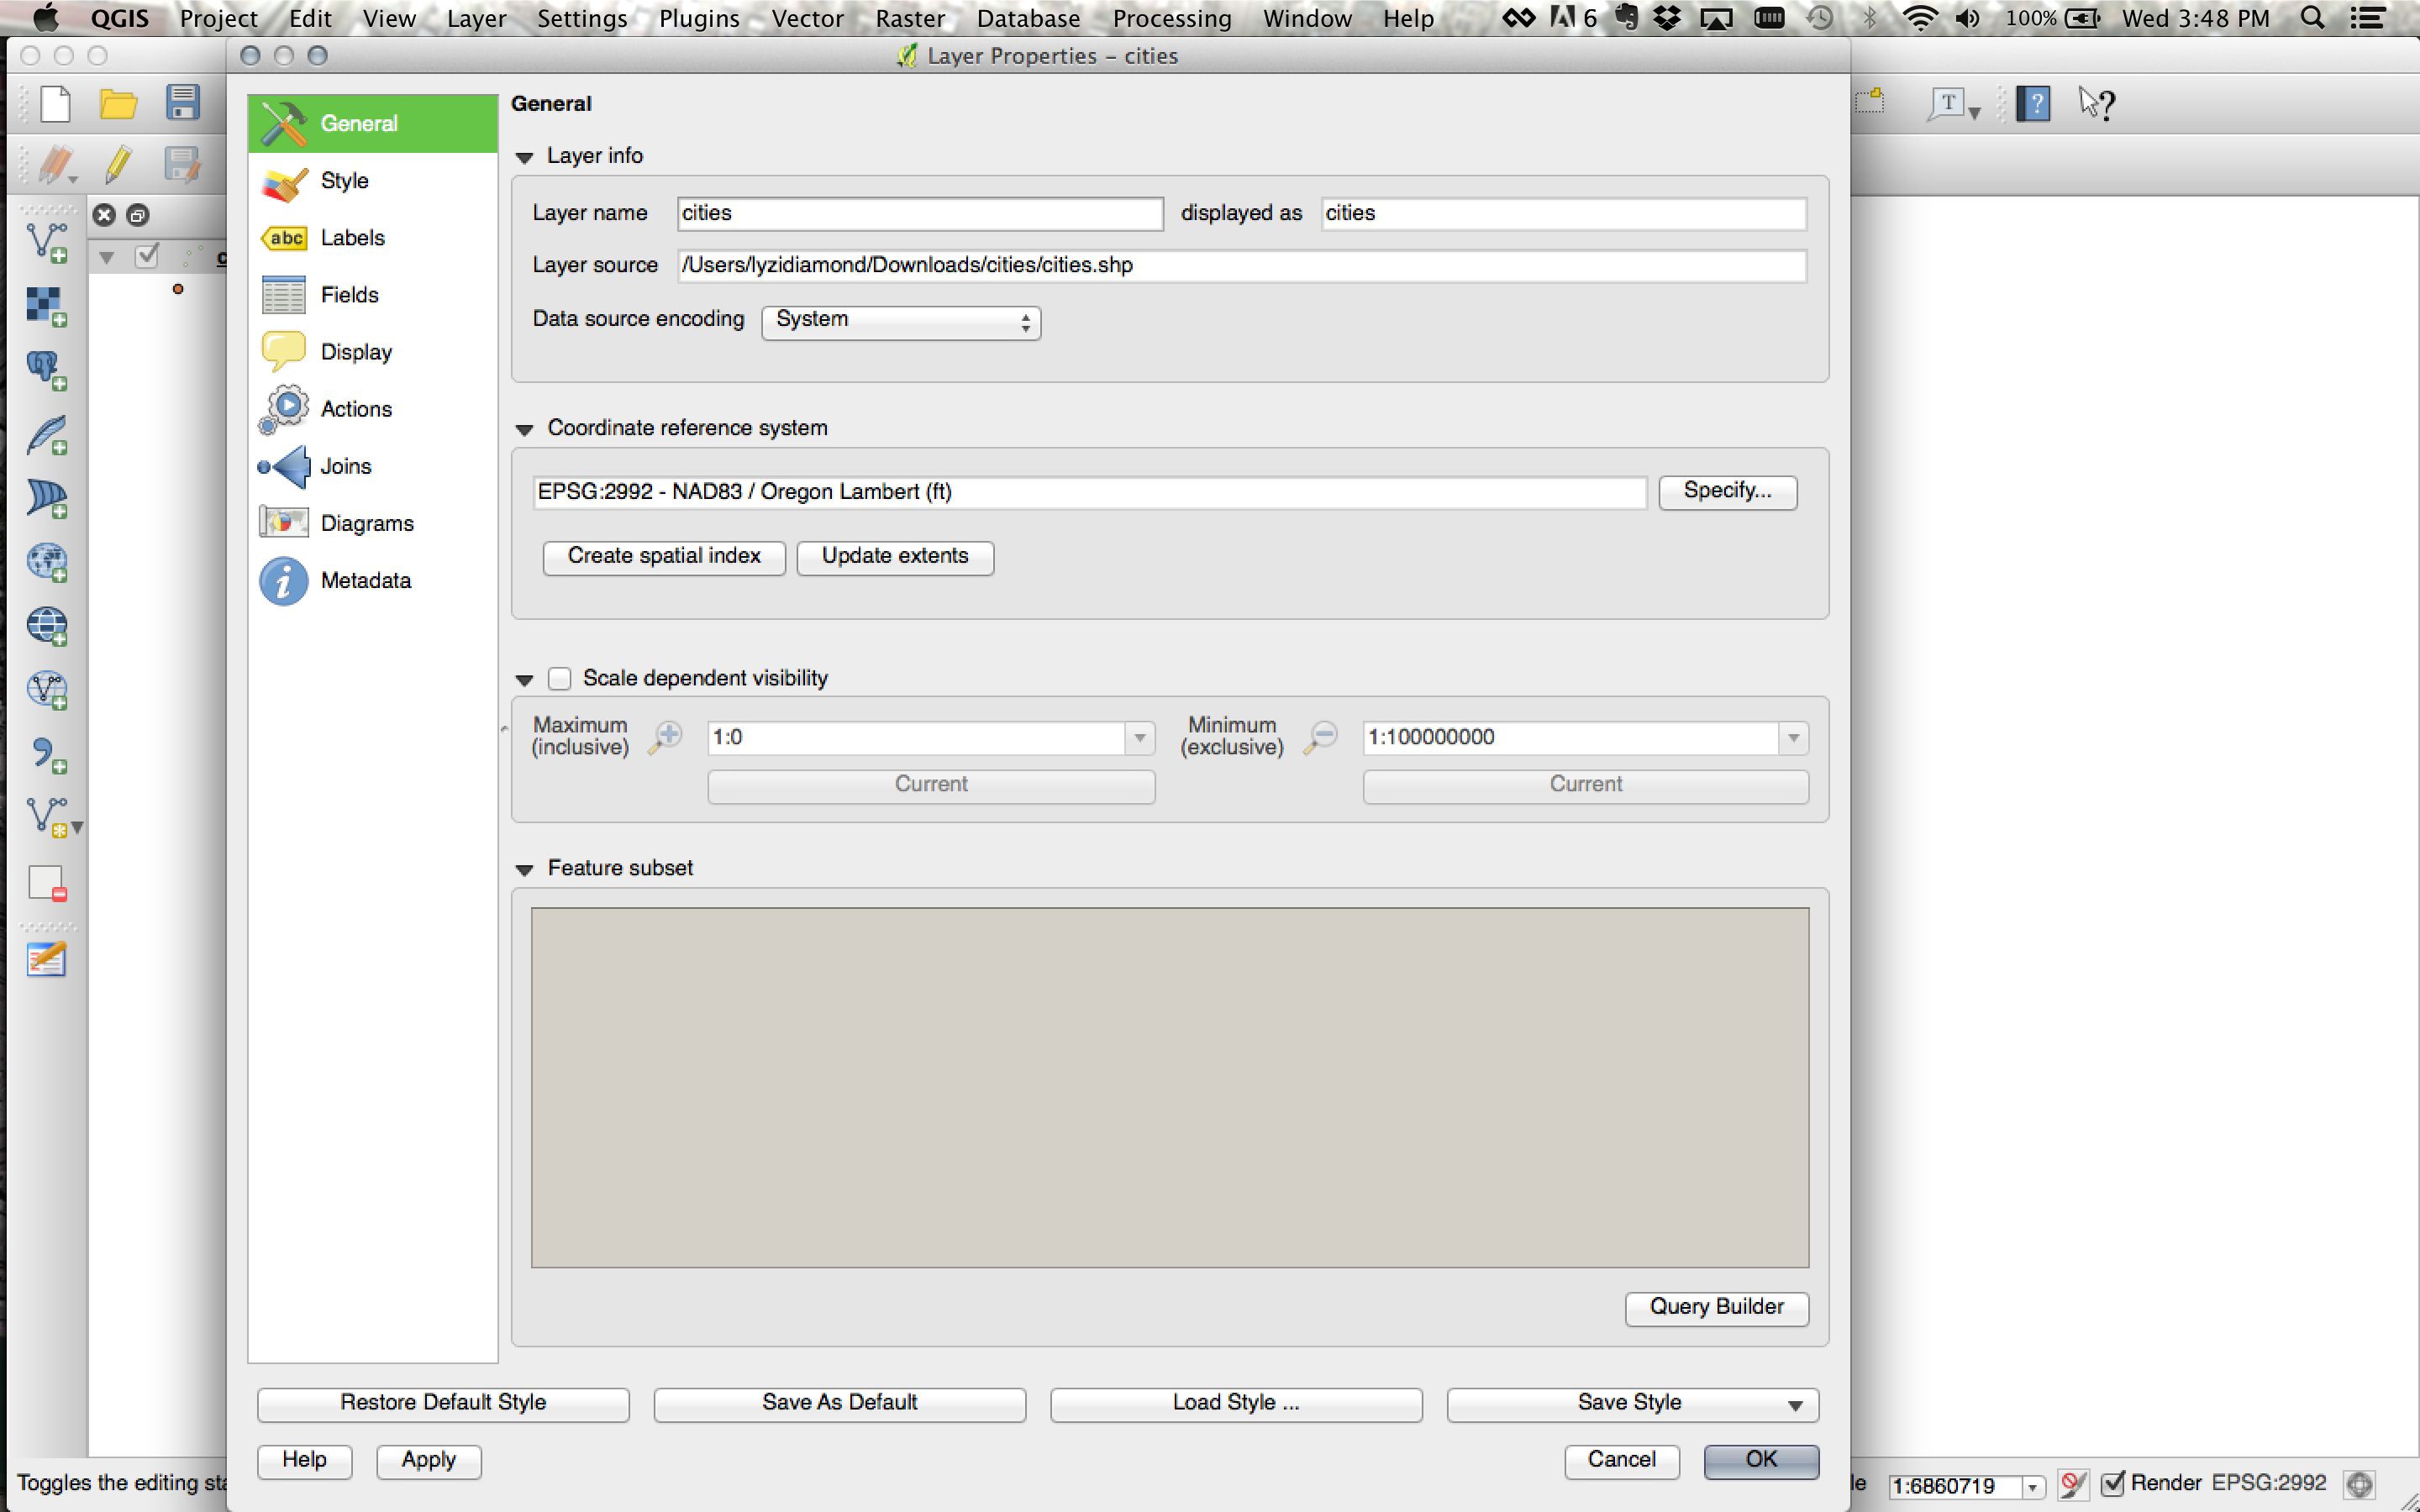
The
prj file generates the coordinate reference system / projection.
Shapefiles can be used with most desktop GIS and spatial analysis tools.
Shapefiles are not used in web maps.
Another
extremely popular geographic data format is
GeoJSON.
GeoJSON is very popular for use in
web maps.
Let's look at some GeoJSON!
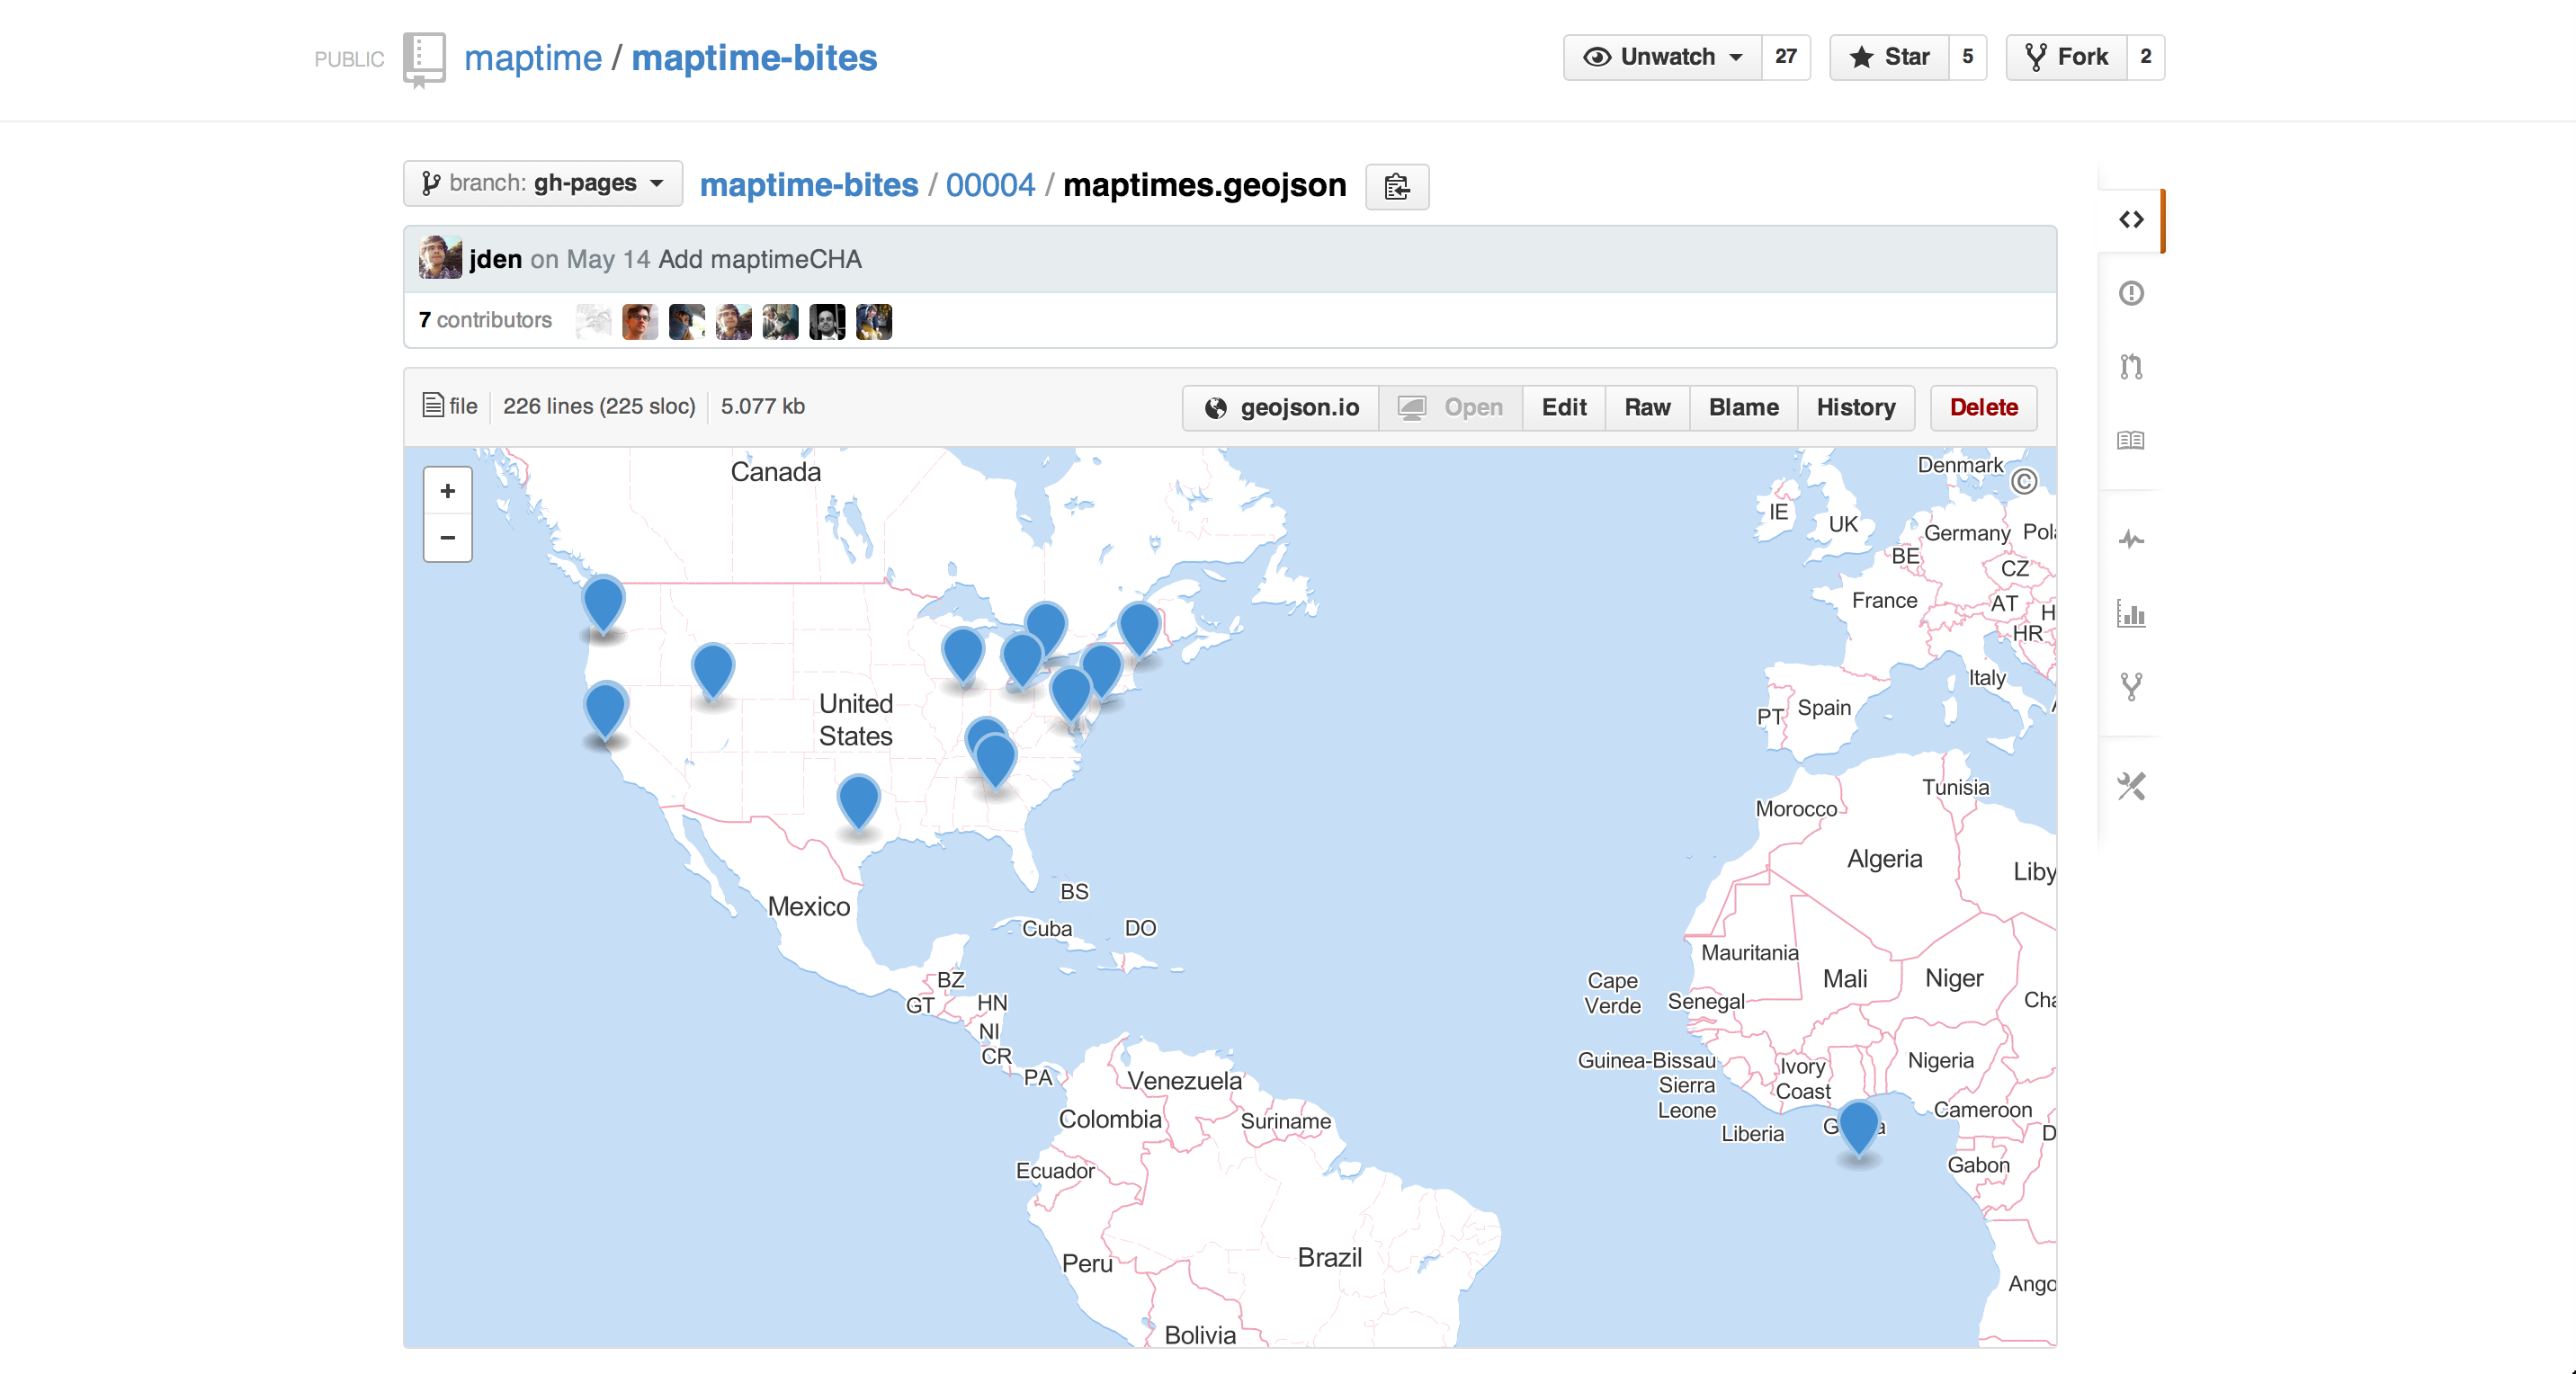
This is a
map displaying the data in the
maptimes.geojson file. Click on the
Raw button.
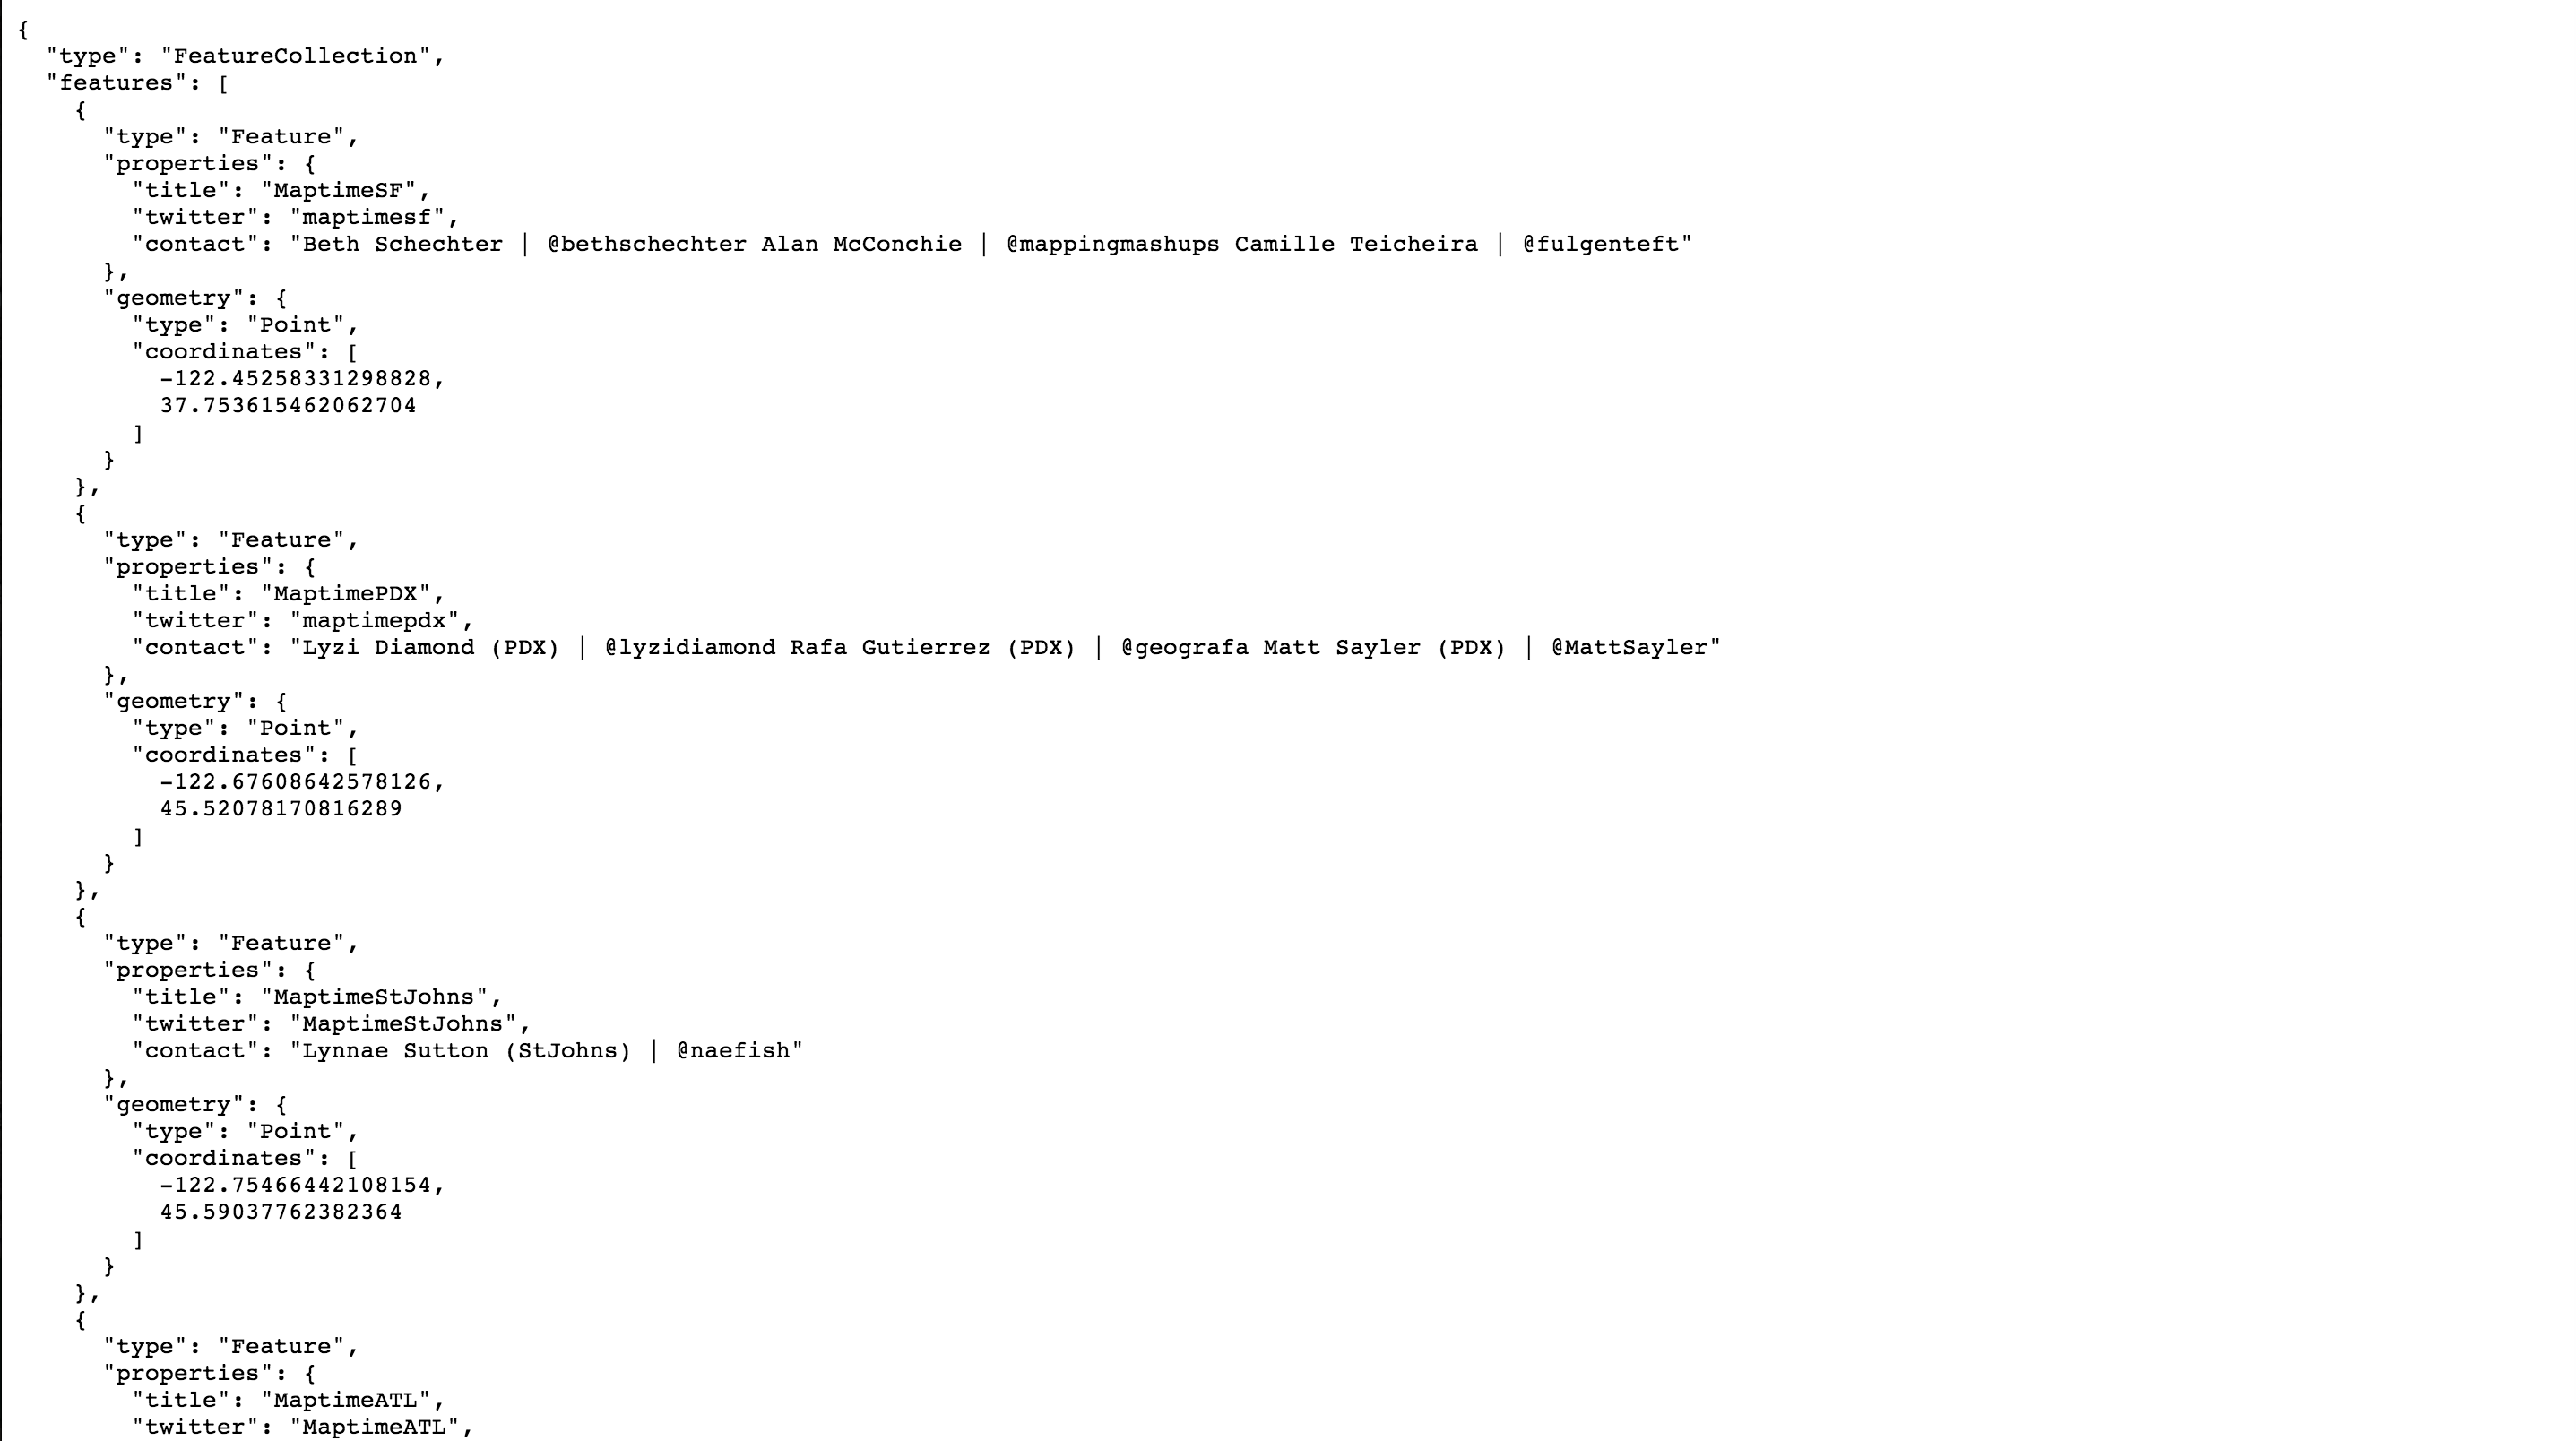
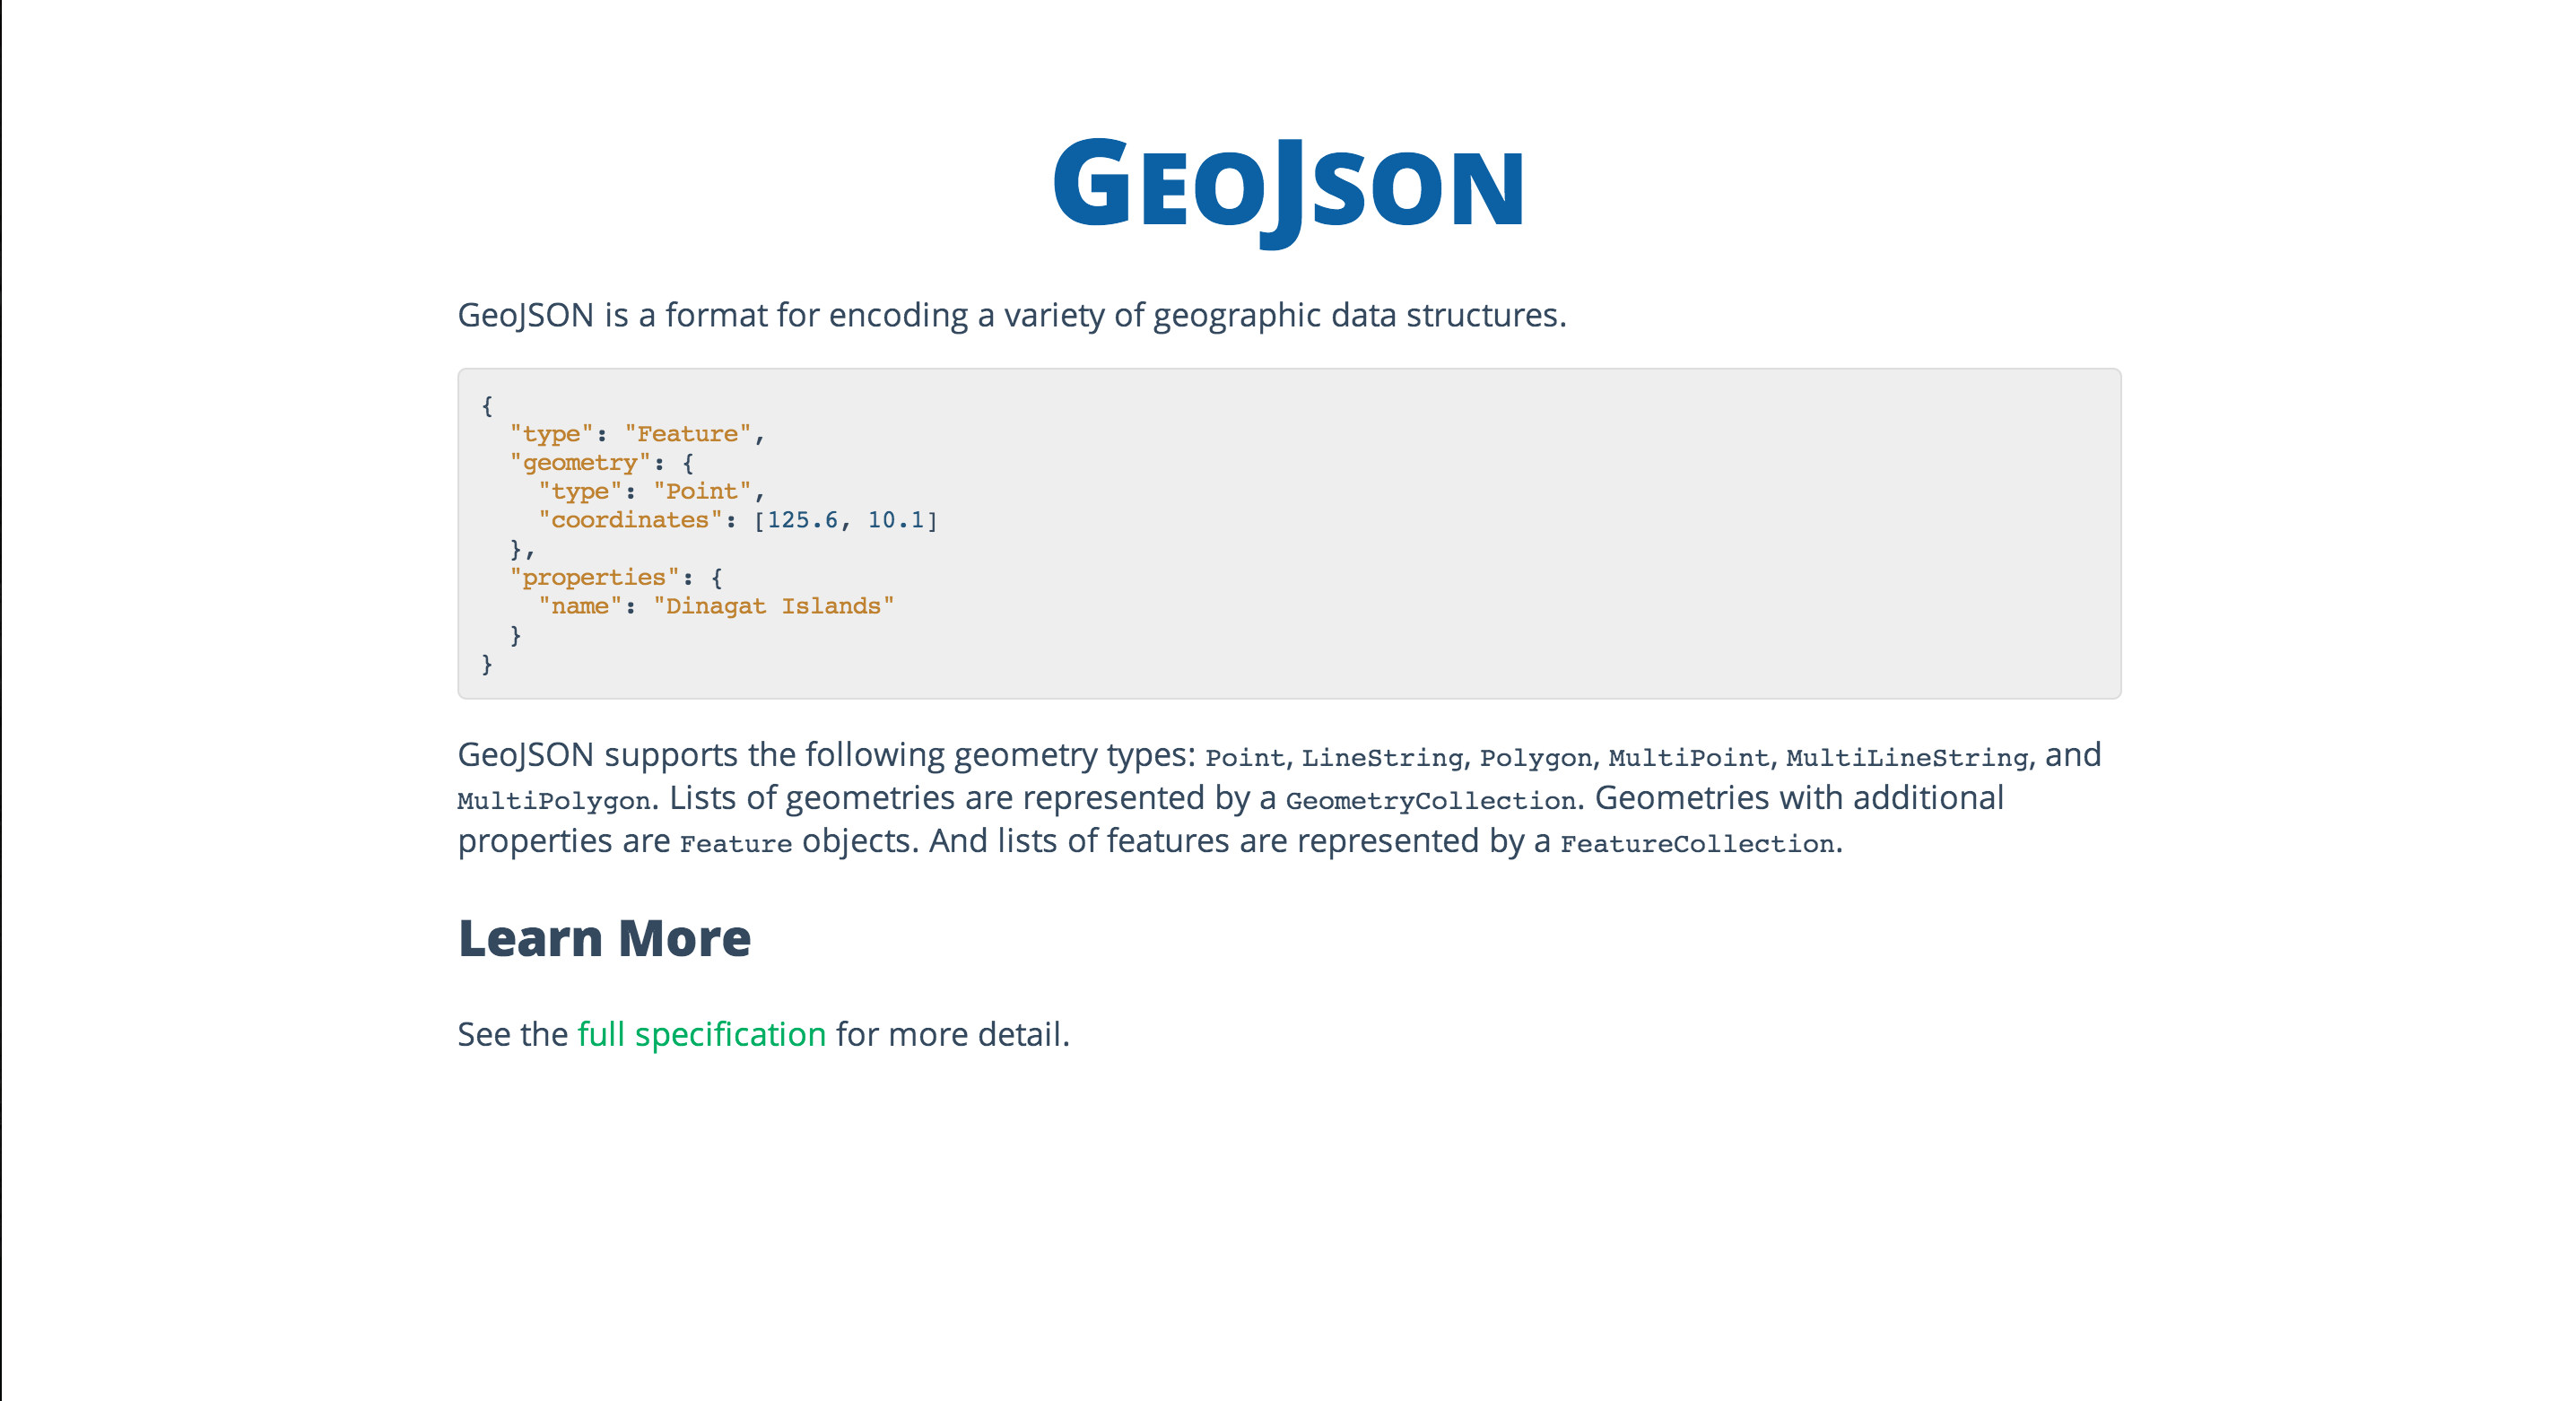
This is what
GeoJSON looks like!
GeoJSON is an extension of a format called
JSON, which stands for
JavaScript Object Notation.
Because GeoJSON is basically just JavaScript, it can easily be used in web maps!
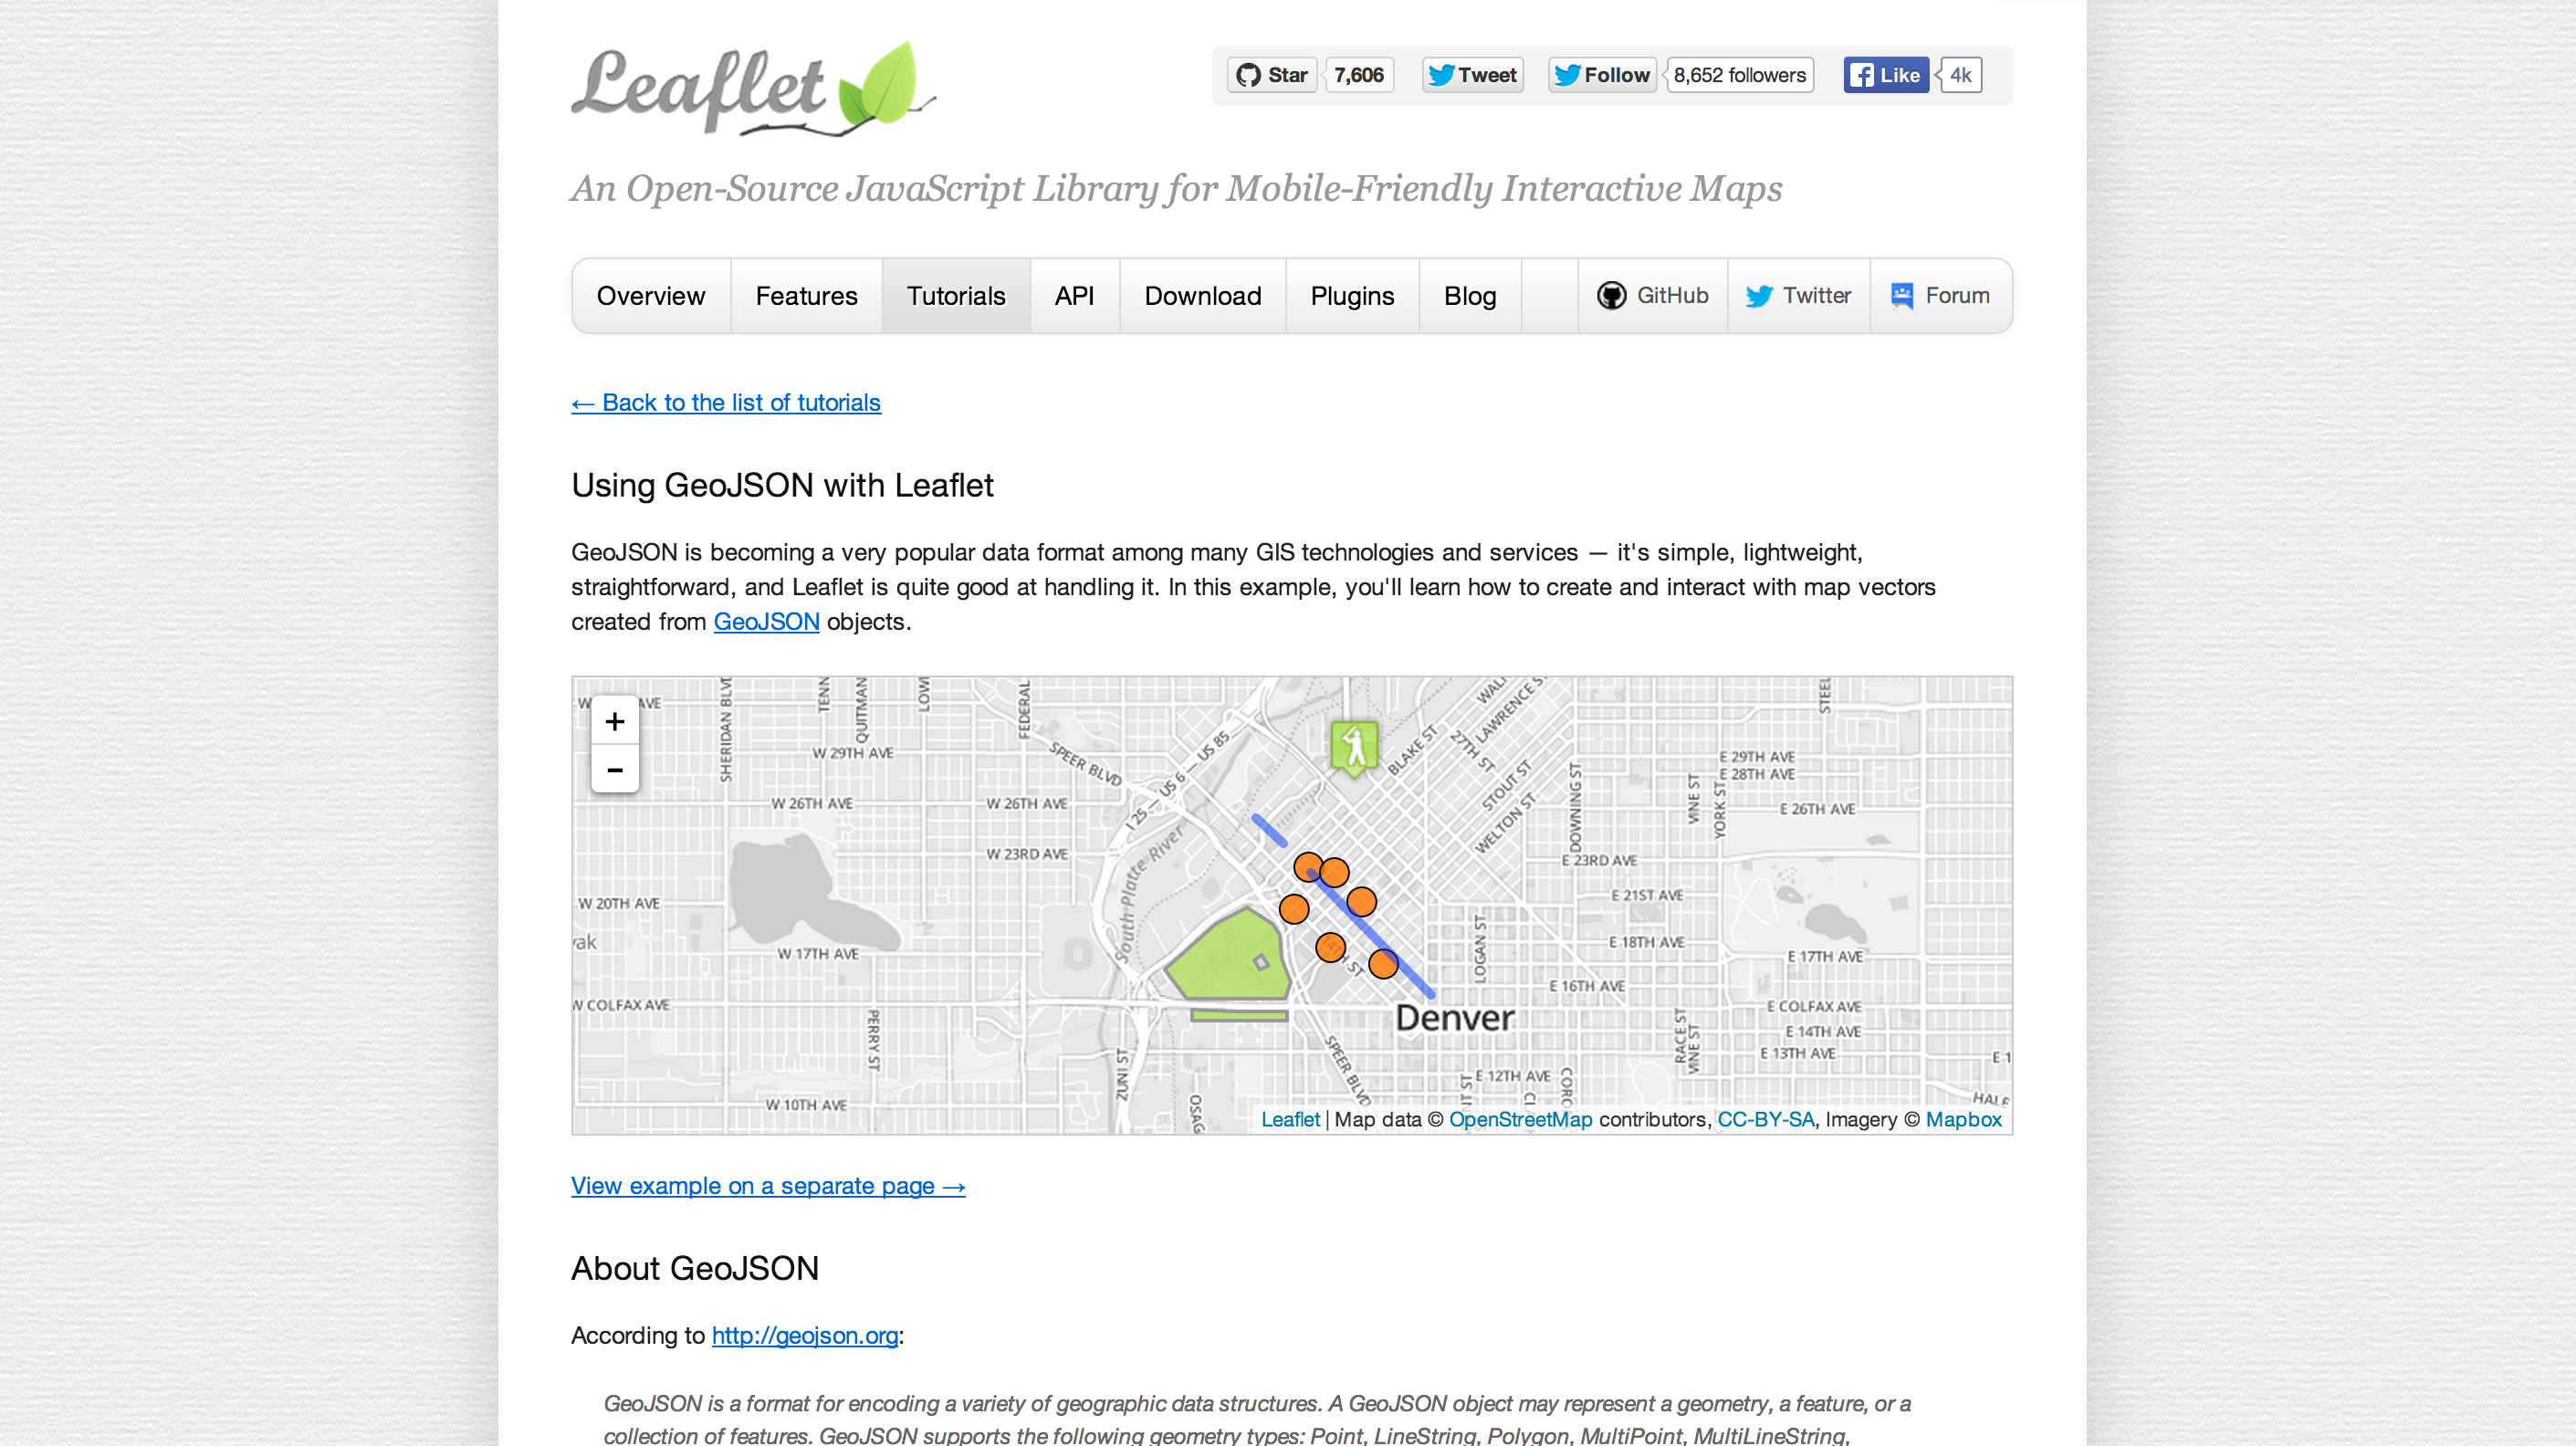
For example, Leaflet loves GeoJSON.
GeoJSON has some required attributes. GeoJSON features need a type, geometry, and properties.
To learn more about GeoJSON's specificities, check out
Learn GeoJSON.
#shamelessplugIn a future
Maptime exercise we will work on putting GeoJSON files on web maps.
:)KML stands for Keyhole Markup Language. It is a file format from Google for use in Google Earth and Google Maps.
KML stores data in a tag-based format. This is similar to GeoJSON, except GeoJSON uses key-value pairs instead.
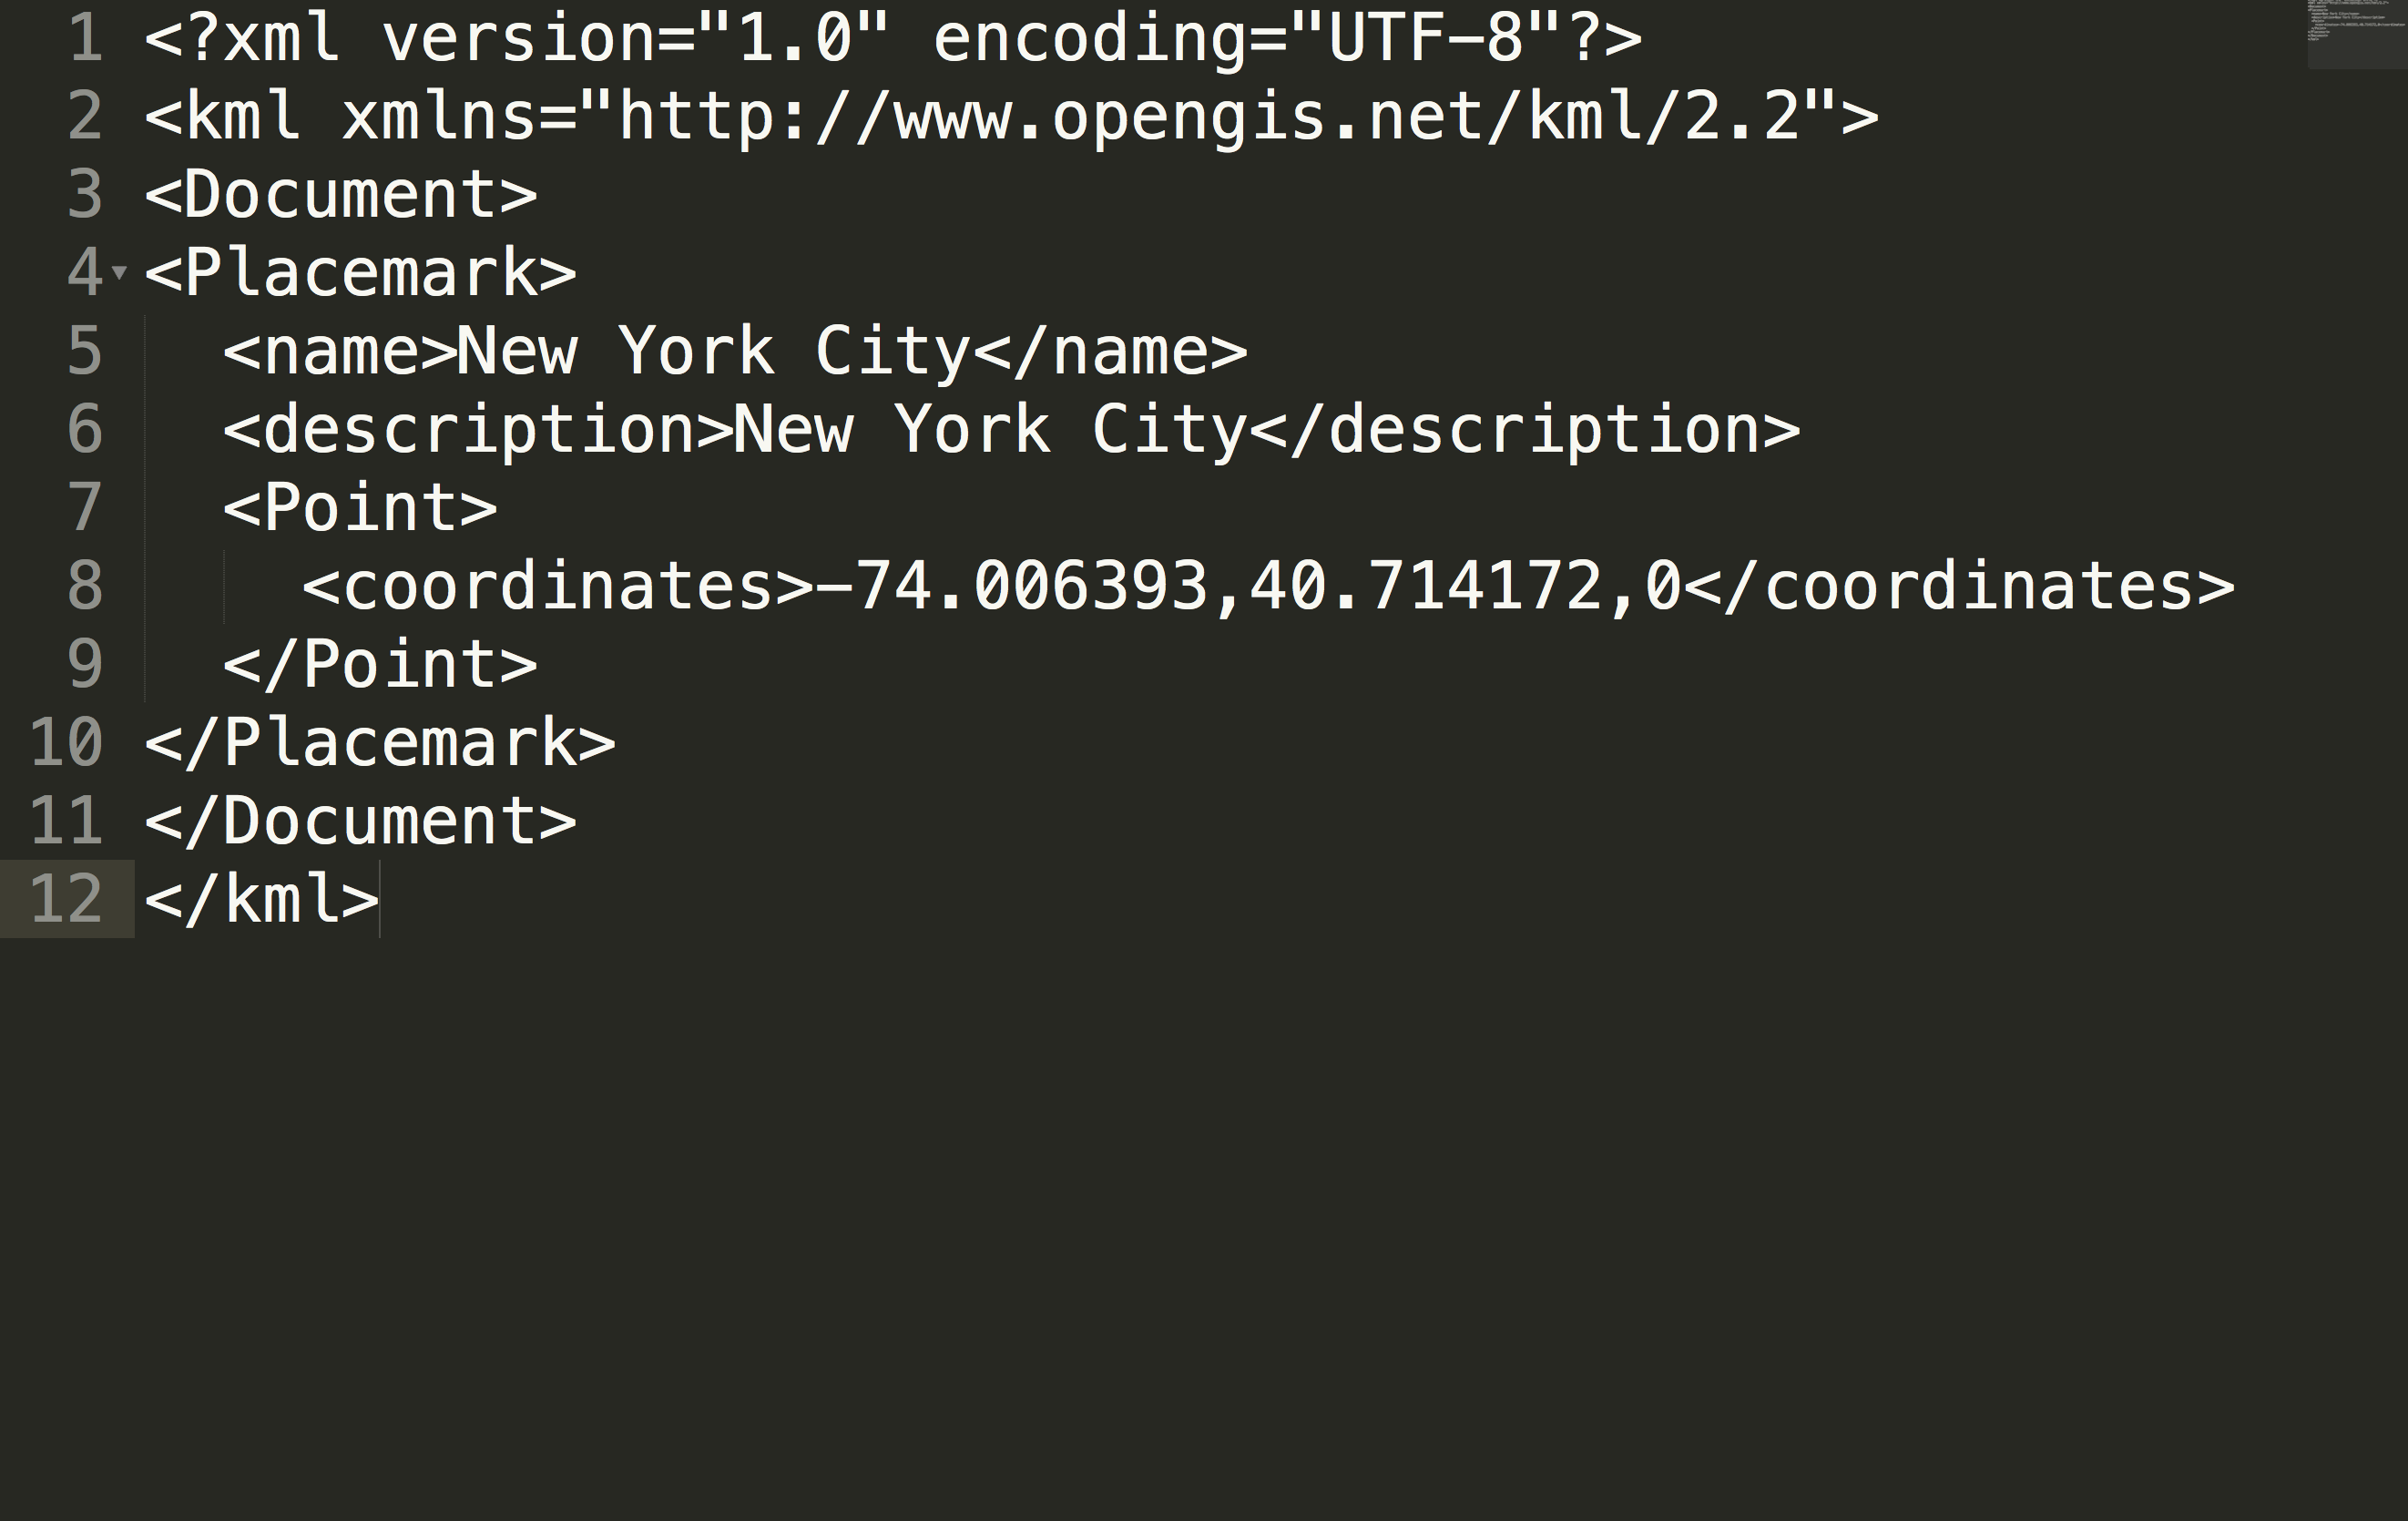
This is what KML looks like.
There are many many other types of geographic vector data, but one last one I'd like to mention here is none other than OpenStreetMap.
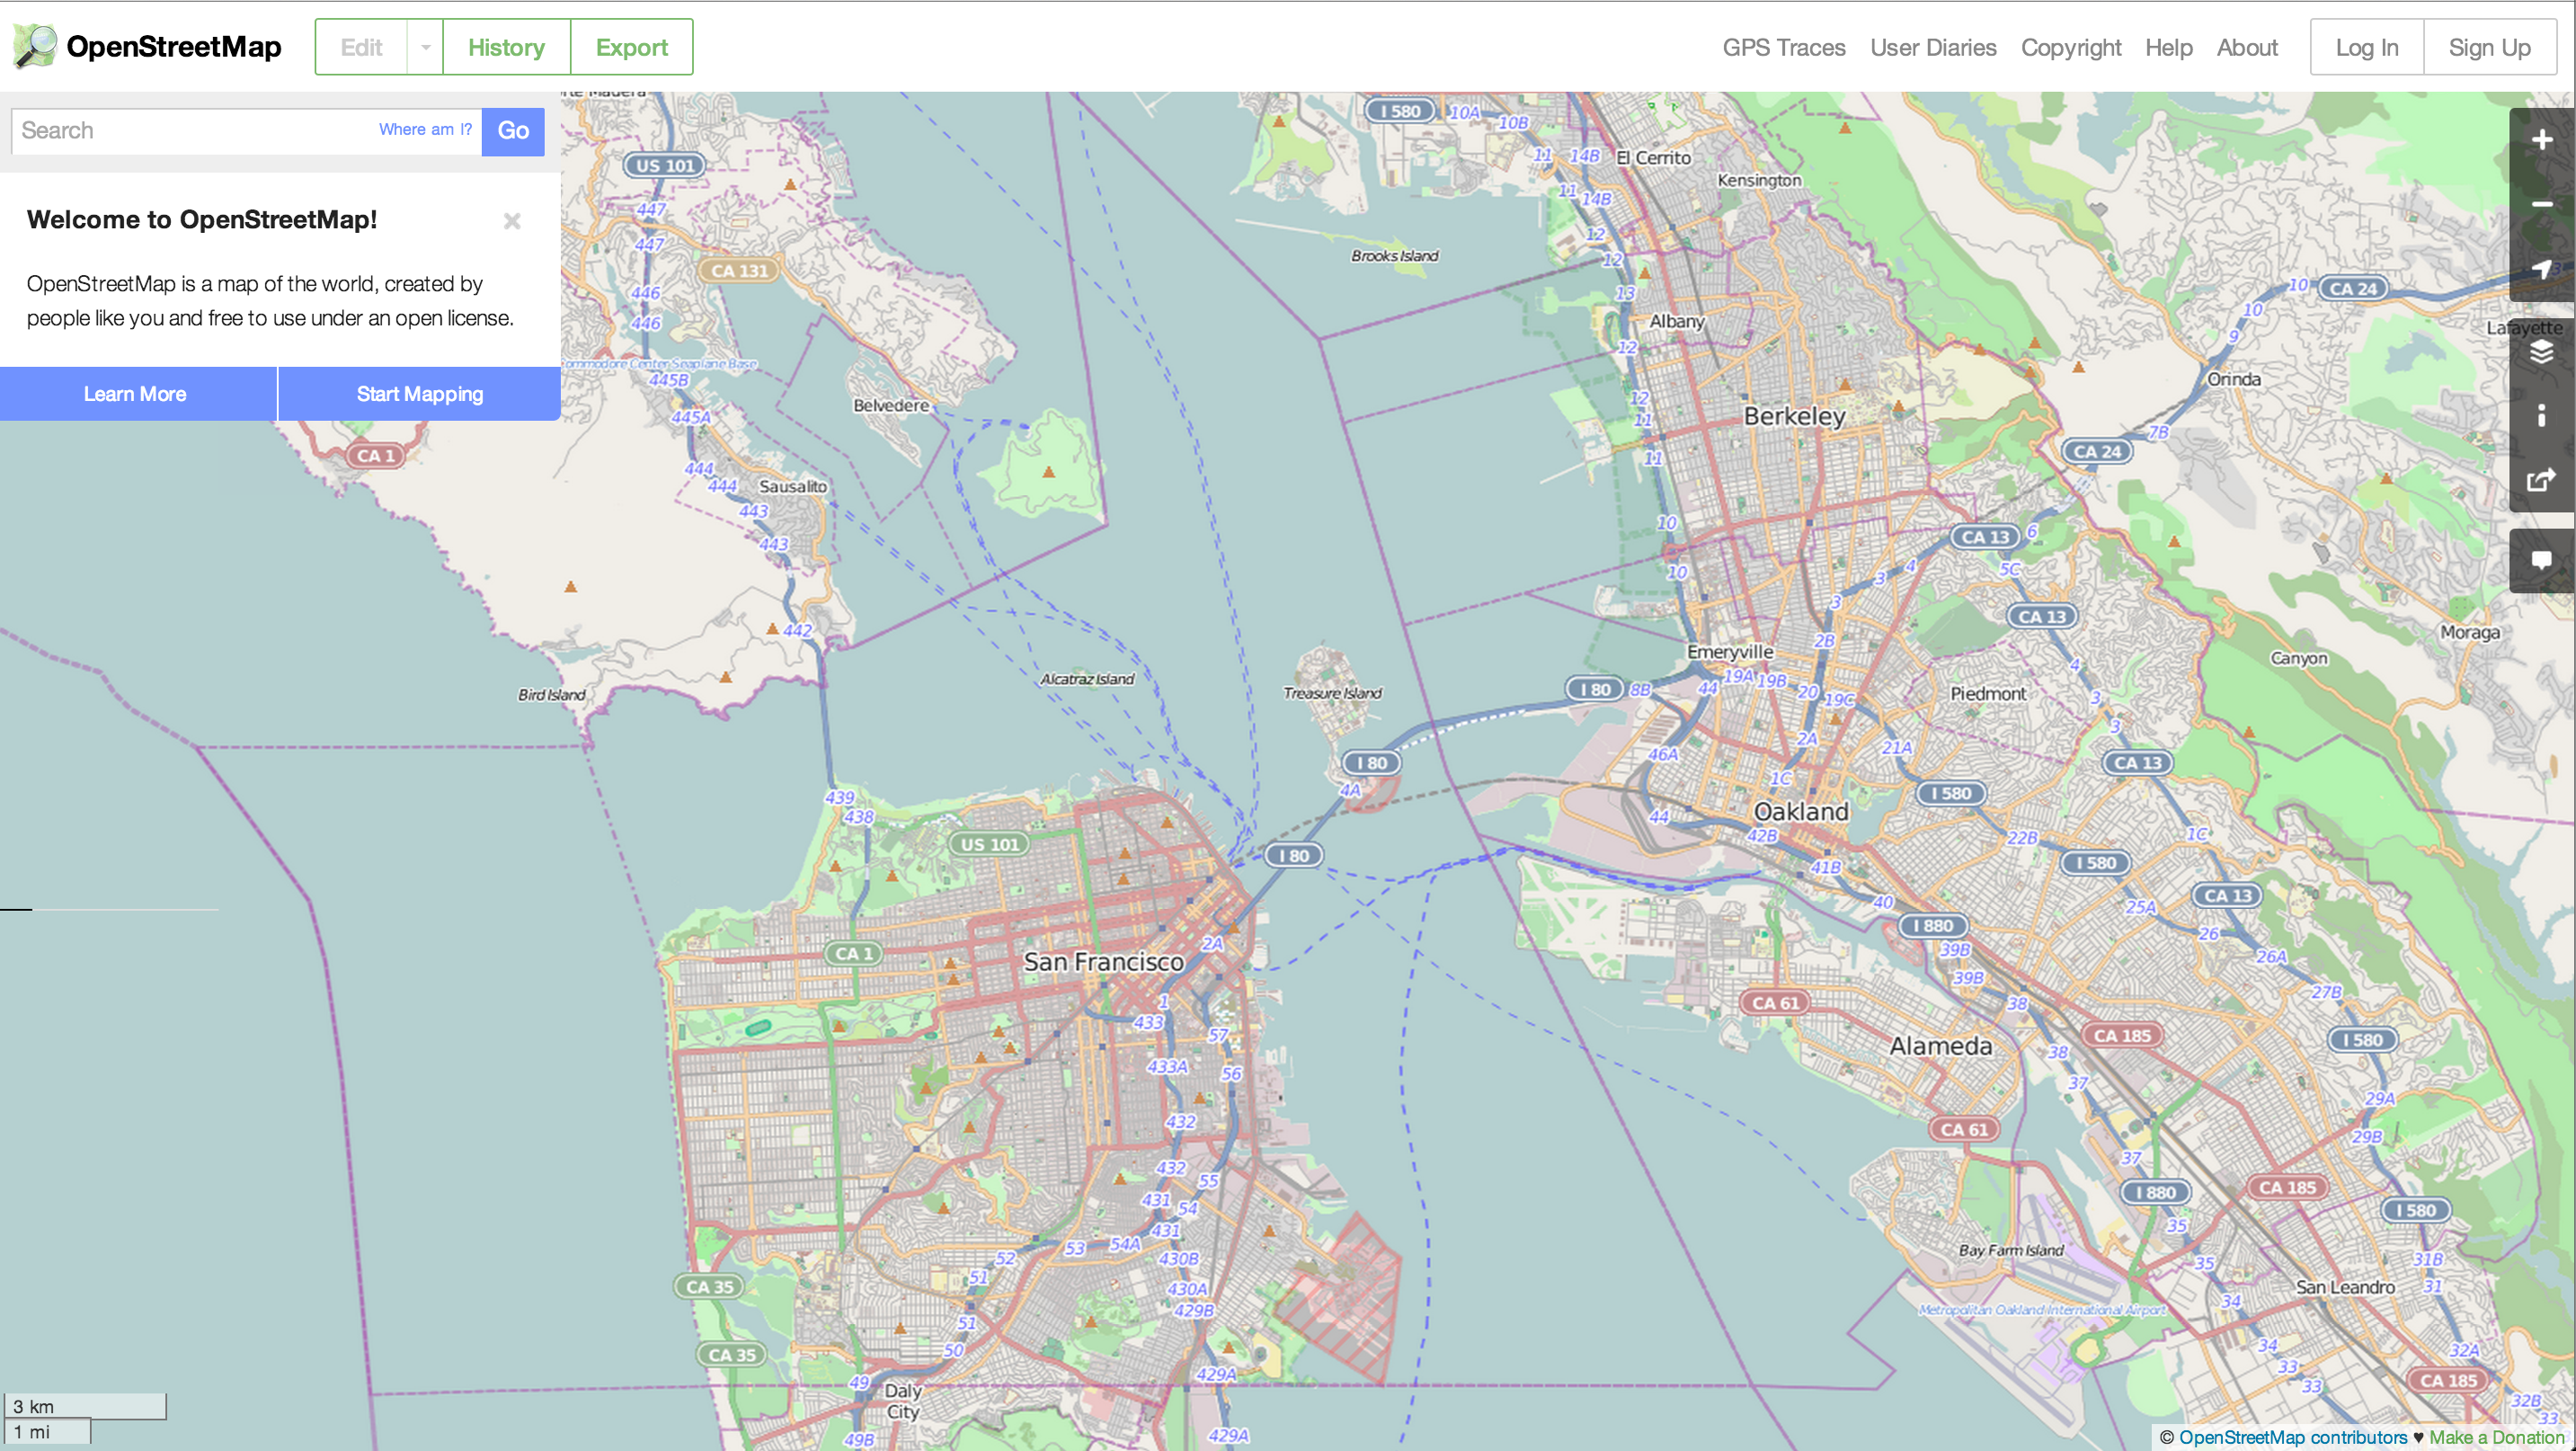
Maptime LOVES OpenStreetMap!
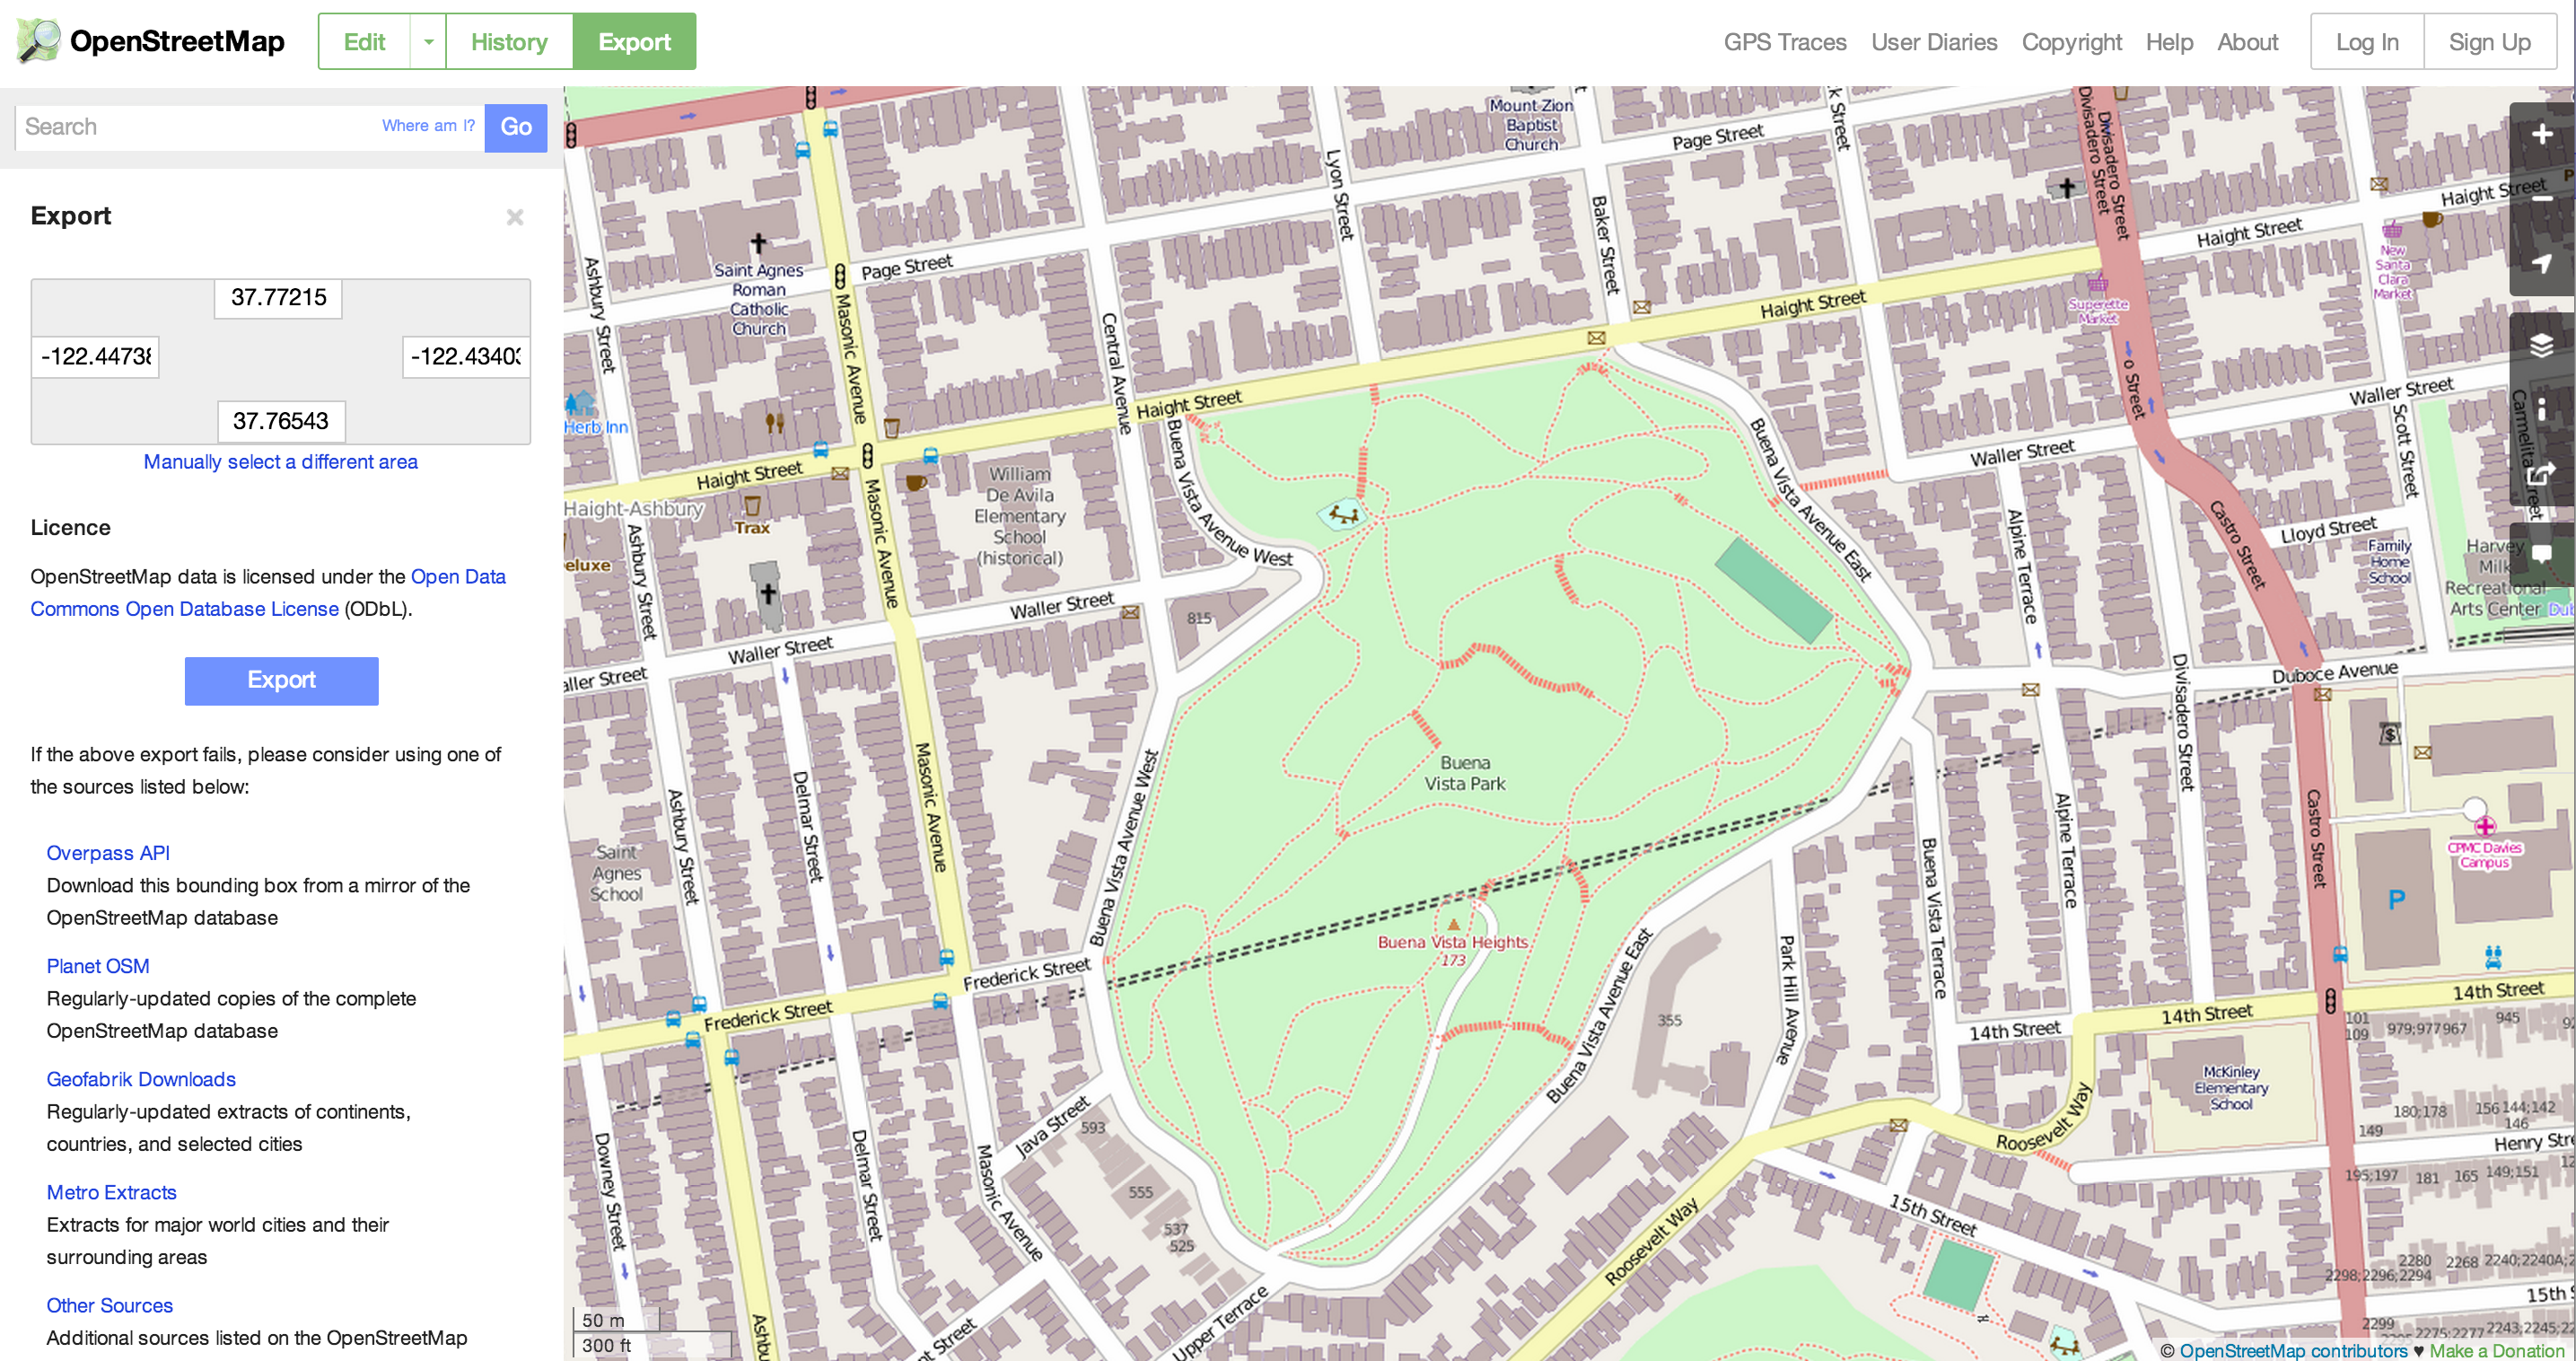
Zoom in, select a
very small area, and click
Export.
A file called map.osm should download. Open it in a text editor.
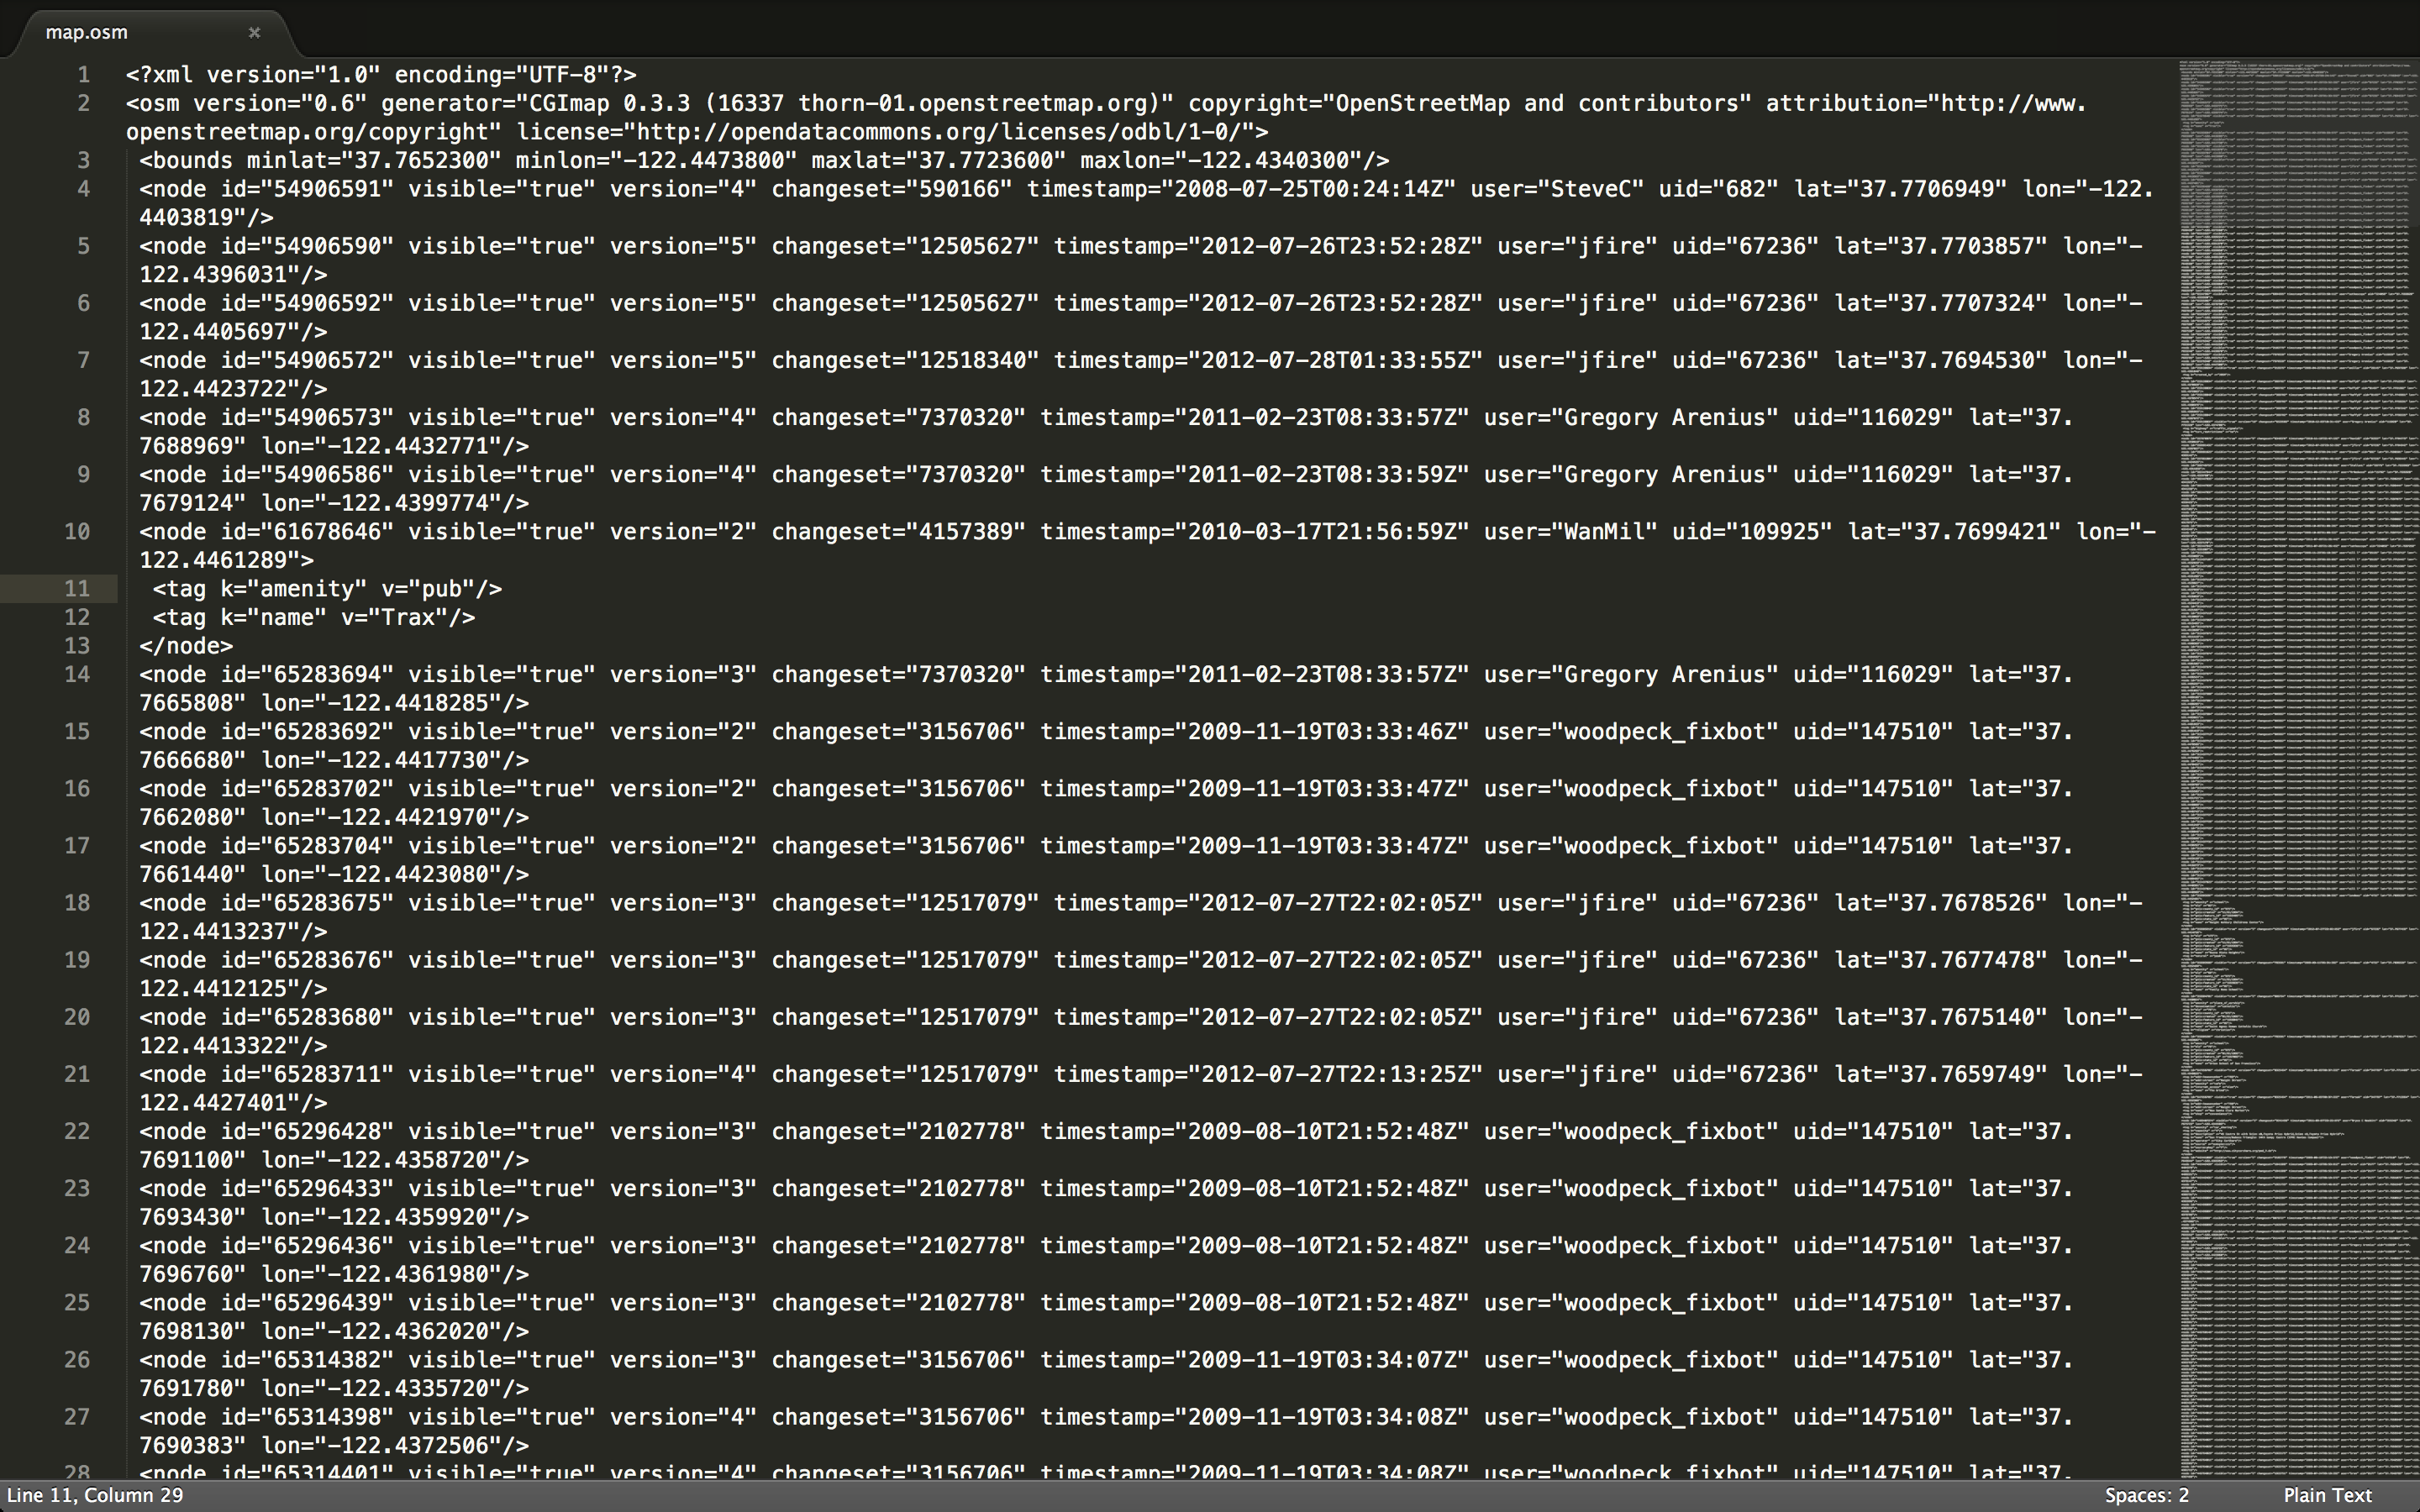
It should look ike this.
OSM data is sort of like KML, but has different information.
It contains a node id, changeset number, user, and of course latitude and longitude, among other info.
Let's quickly talk about raster data.
Like vector data, raster data contains location. But it stores its attribute information differently.
Raster data stores its information in its pixels. This information can include height, slope, direction, color, and many others.
As far as formats, a very popular one is the GeoTIFF.
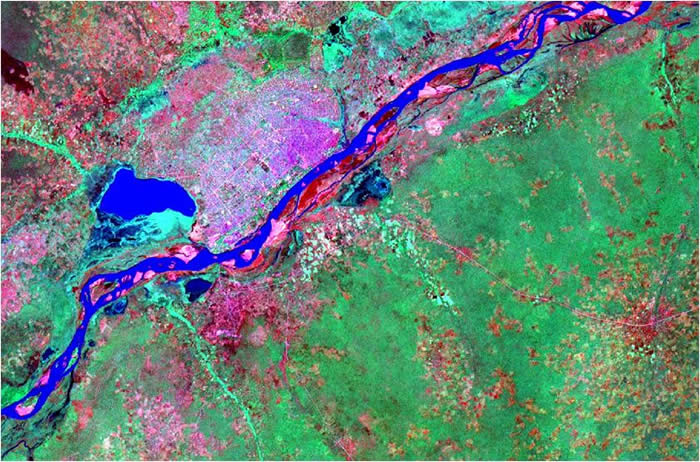
OMG GeoTIFF
A GeoTIFF is simply a TIFF (tagged image file format) file that maintains location information.
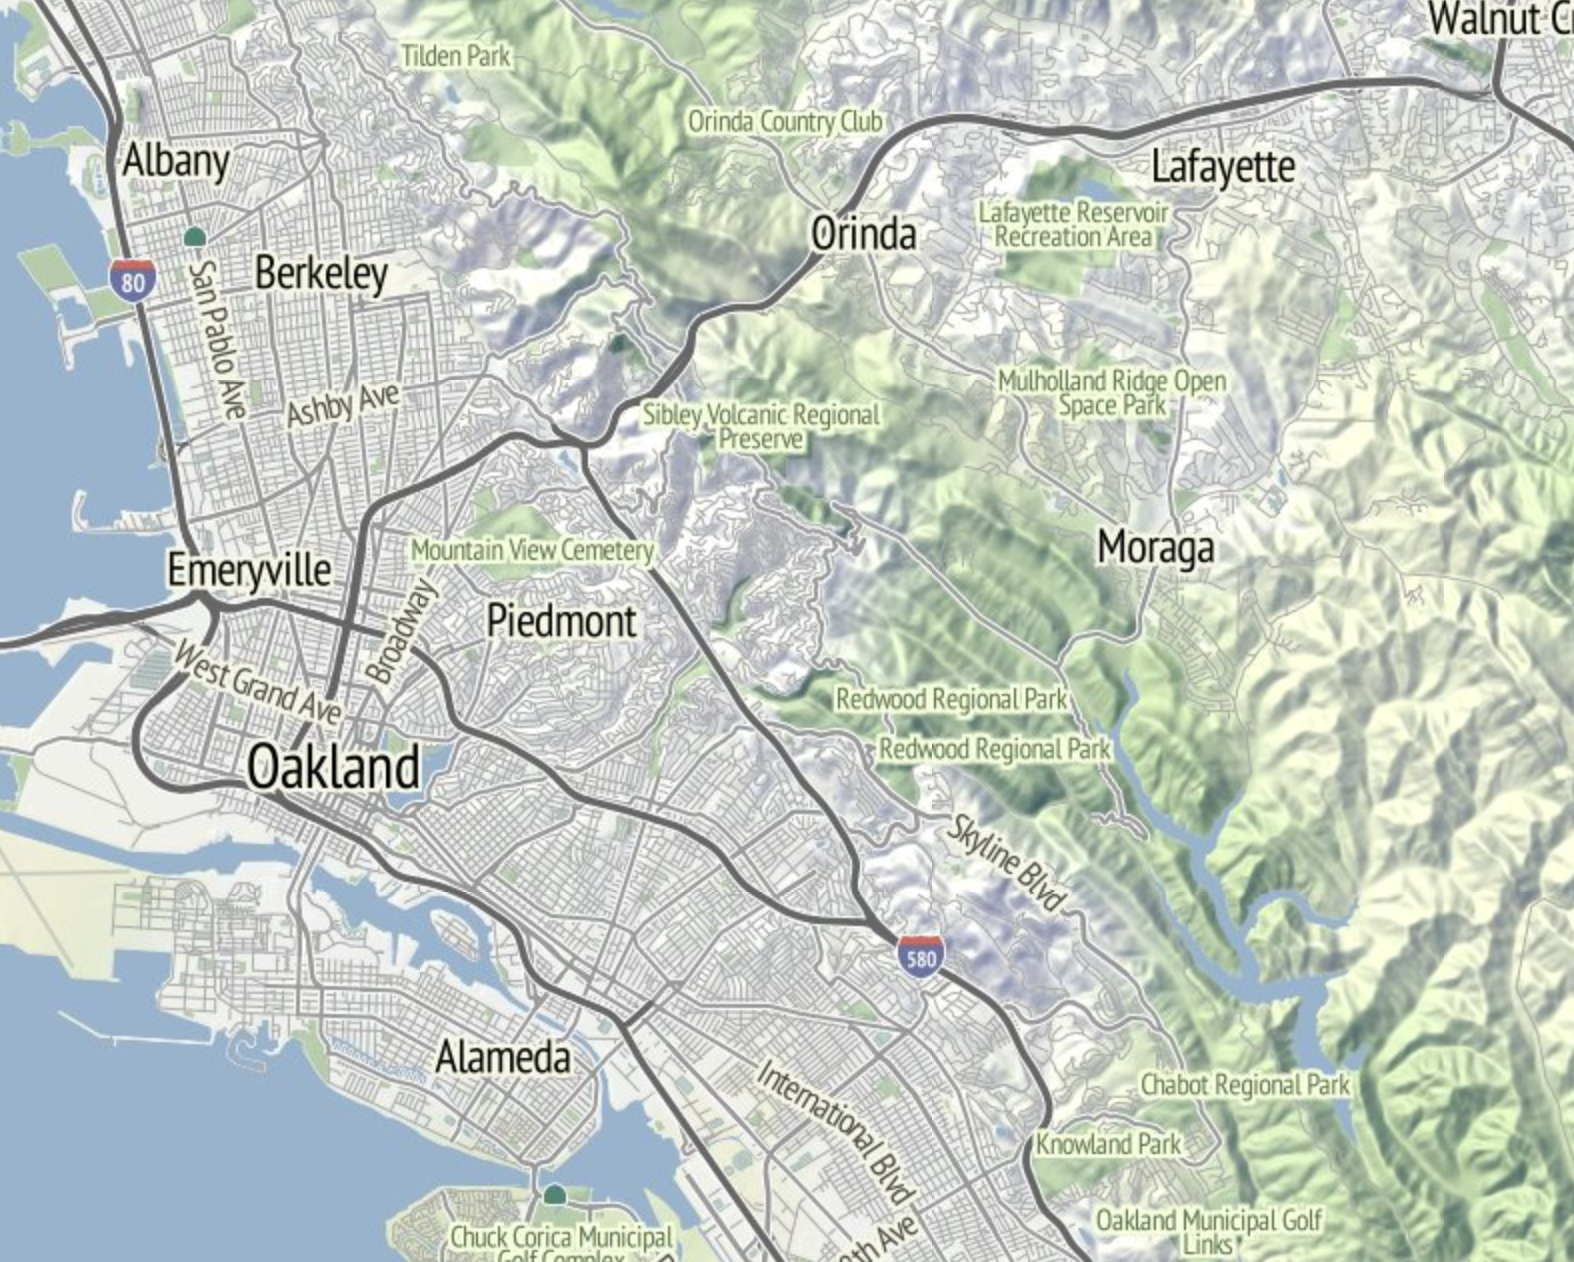
The most typical uses for rasters in a geographic context are digital elevation models and aerial photography. These can be used to make other things, too.
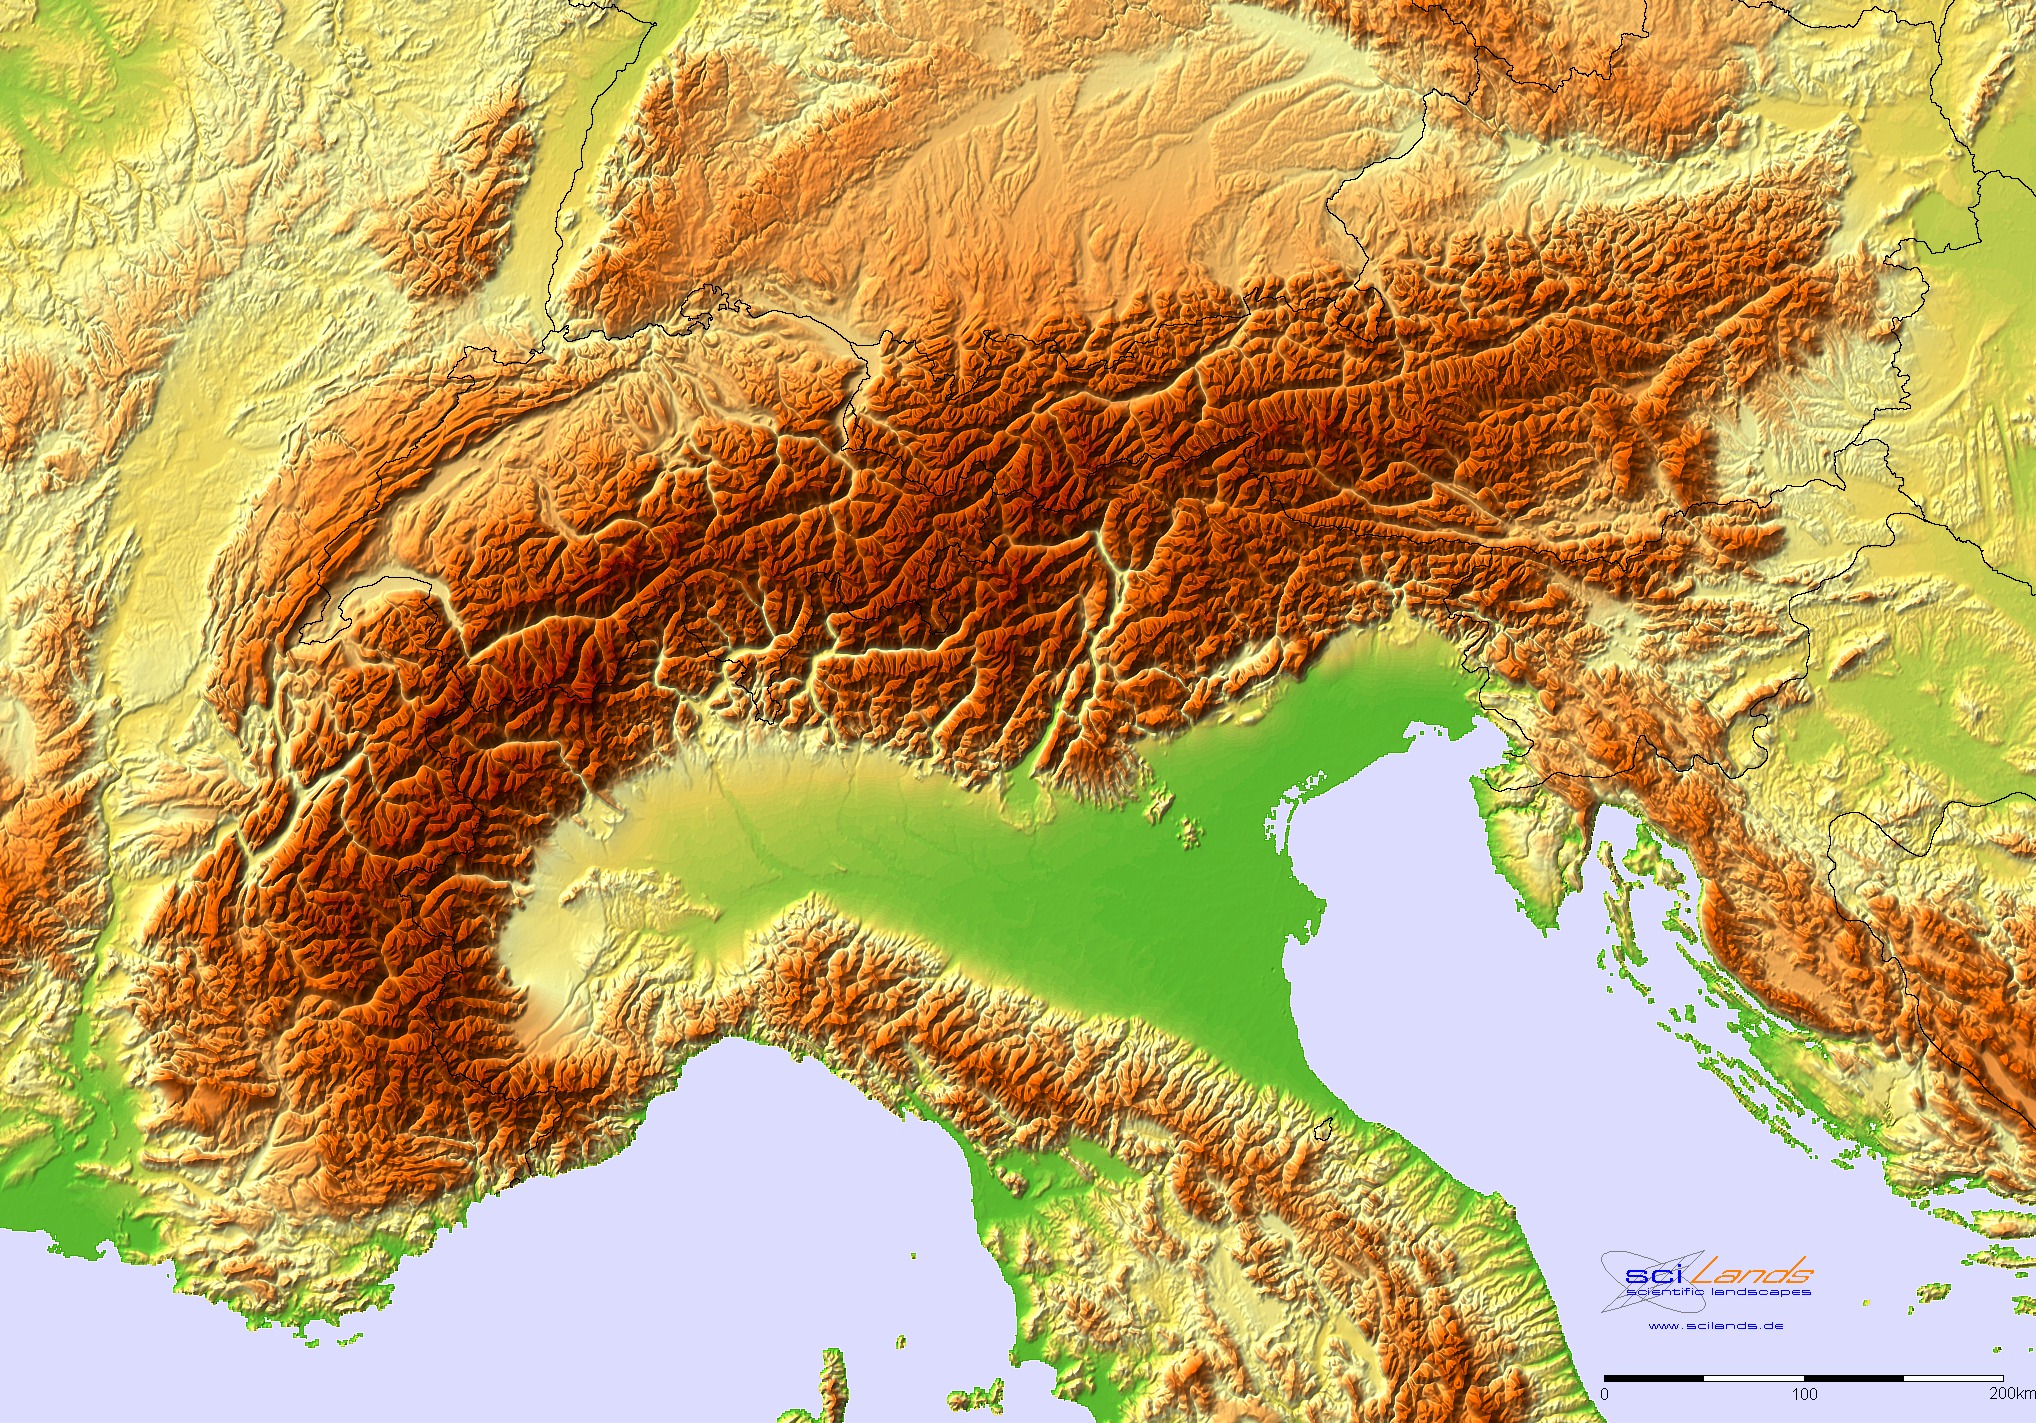
One example: digital elevation models can be interpolated to make hillshades.
Just as many spatial problems can be solved with raster data as vector data. What are some of them?
In addition to rasters and vectors, there's one other very popular geo data type.
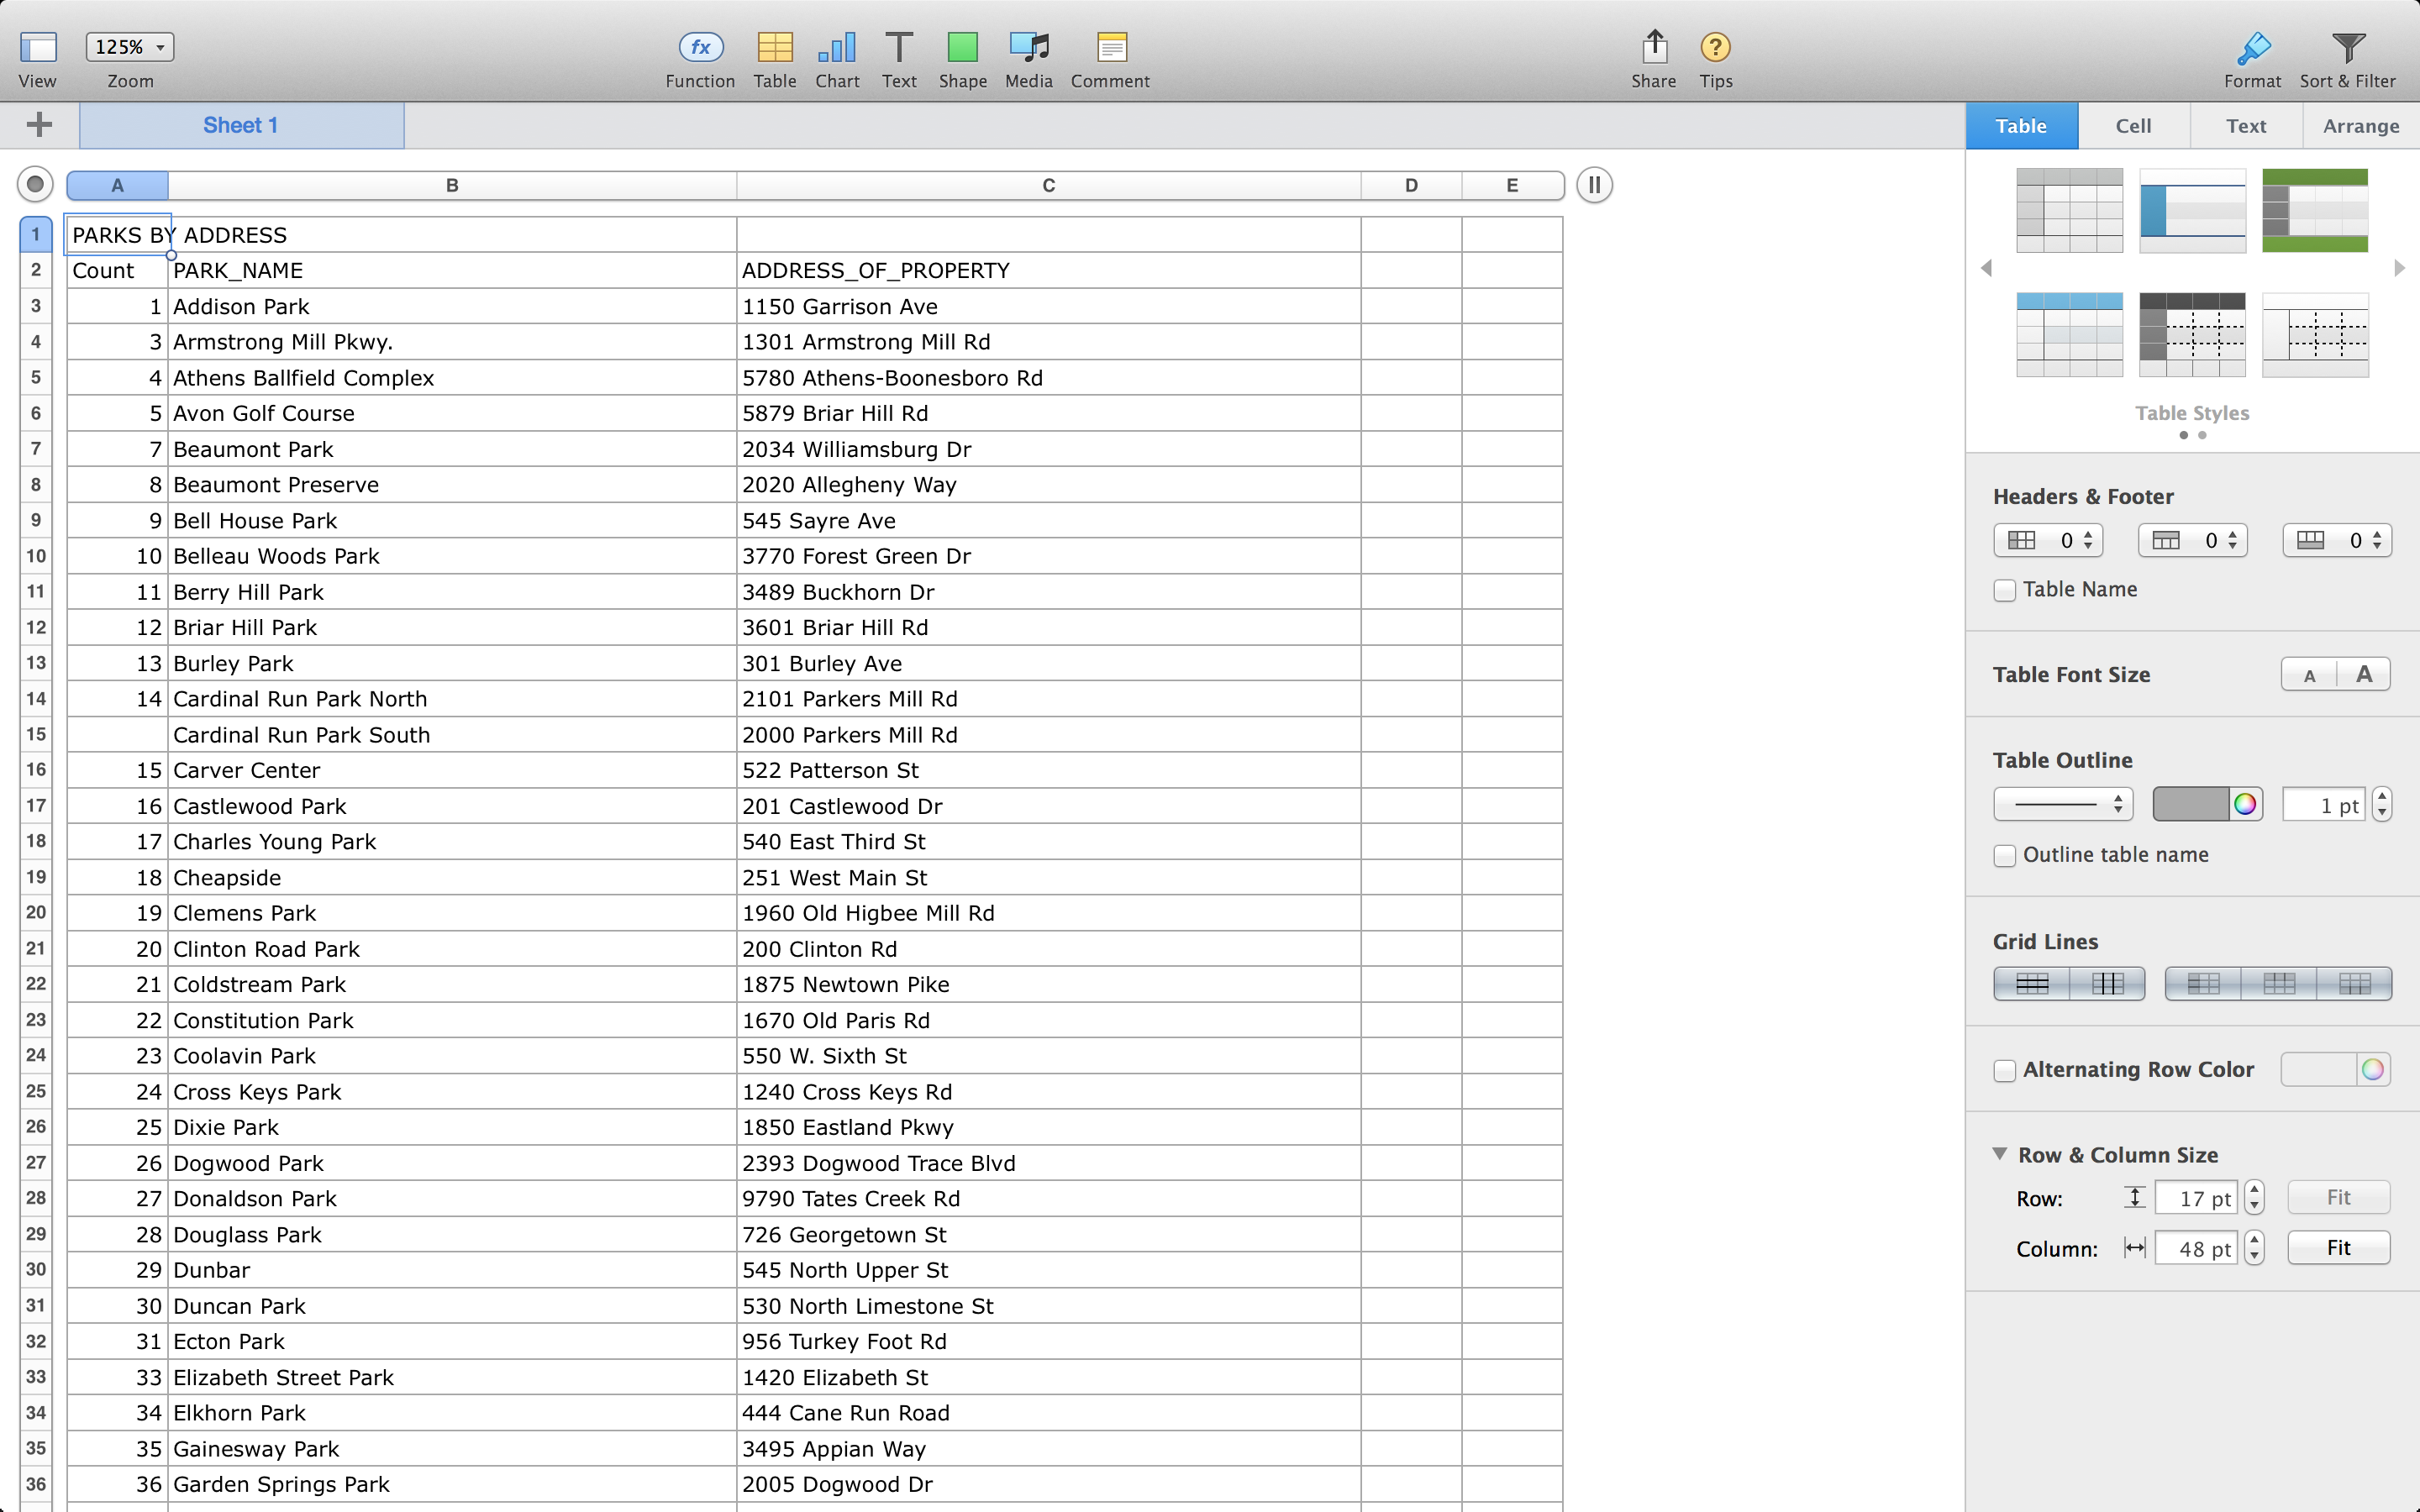 Tables!
Geographic data is very commonly stored in tables of various types.
These include CSV, Excel, Google Spreadsheets, and many others.
What are some places you might find tabular geographic data?
Tabular data can be geocoded to be displayed on a map.
(Geocoding also deserves its own conversation.)
There are
many more formats than the ones we just talked about.
(If you're going to poke around, check out PostGIS first. Super powerful.)
Much of the work in geo these days requires some data transformation.
There are
many tools that allow for transformation, including
QGIS,
GDAL, and
OGR2OGR, among others.
What did we learn today?
Geographic data exists in a variety of formats.
Shapefiles are commonly used for spatial analysis and visualization on your desktop.
GeoJSON and KML are commonly used for web maps.
You can download vector data from OpenStreetMap!
There are lots of places on the internet to find geographic data.
Heck yes!
Just knowing about these few data types can make you a very strong geographic data user.
YOU'RE A CHAMPION! Keep learning more!
Thanks.
Lyzi Diamond, @lyzidiamond, lyzidiamond.com