PLEASE interrupt if you have questions!
Part 1/3: Geography and GeoData
~
some fundamentals for making maps
round -> flat
places on Earth are represented as places on flat surfaces, like print-outs or computer screens
doing this requires a:
- a system for describing locations
- a method for projecting a location from the round thing to a location on the flat thing
A coordinate system describes locations.
Lat/Lon is used to represent location on both the Earth as a globe (a sphere-like 3-D object) and Earth as a map (a planar, 2-D object)
To go from a globe like this...
...we need a map projection.
a method in the form of a mathematical equation for stretching and warping the lat/long grid of the globe to fit a planar map
But there is no way to project the globe without distorting it.
Distortion is typically worst at the edges of the map, affecting relative scale.
To avoid distortion, many projections are purpose-built:
they are specific to an area, or are designed for functionality (e.g., measuring distances from a certain point).
Pennsylvania State Plane (South)
EPSG (European Petroleum Survey Group) code 2272
A few projections provide a decent balance between
- relative scale,
- visually-pleasing proportions,
- and straighforward measure-ability
on a global scale.
Web Mercator
EPSG code: 3857
East-West distance is constant.
North-south distance is distorted close to the poles.
Why you need to know this:
Web Mercator is the projection commonly used for web maps and typical web map-making software/tools/libraries.
Local data in southwestern Pennsylvania is typically stored in PA State Plane (South) / EPSG 2272. It uses feet, not decimal degrees, and must be re-projected to use in a web map.
espg.io is a coordinate system search engine with an API. Really cool.
GeoJSON is an open standard format designed for representing simple geographical features, along with their non-spatial attributes, based on JavaScript Object Notation (JSON). src:wikipedia
You can interactively make a geojson file with geojson.io.
Let's give that a try, and save a GeoJSON of our own.
and/or save fishfries2016.geojson demo data for later
Part 2/3: Open Street Map + FOSS geo tools
~
Your map needs contextual data: roads, rivers, points of interest, etc.
Someone else has already pulled all of this this together for you in Open Street Map (OSM), and a bunch of software is built to use OSM.
Why you need to know about Open Street Map and basemaps:
Base maps provide context. Good cartography will make your data POP and help you tell a story with your data.
The benefit of using a base map like OSM is that if you find a discrepancy, it is within your power to fix quickly, and everyone wins.
and...
OSM is relied upon by many free and open source software (FOSS) geo-tools.
In rough order of "off-the-shelf-completeness" for those new to web map development:
"Mapnik is an open source toolkit for developing mapping applications...basically a collection of geographic objects like maps, layers, datasources, features, and geometries...It is intended to play fair in a multi-threaded environment and is aimed primarily, but not exclusively, at web-based development." src: Mapnik on Github
Mapnik powers Open Street Map and many other FOSS geo tools
BUILDING BLOCKS: Leaflet
"Leaflet is an open source JavaScript library for mobile-friendly interactive maps...it has all the features most developers ever need for online maps." src: Leaflet on Github
With some basic web-dev skills, make simple, functional, and great-looking web maps.
"OpenLayers 3 is a high-performance, feature-packed library for creating interactive maps on the web." src: Open Layers on Github
A full-featured web mapping library, with support for WebGL, 3D, many projections, lots of data types, animation, etc. Many examples for creating your web map.
BUILDING BLOCKS: Mapzen
"Mapzen builds open-source mapping tools and collaborates on open geodata initiatives. " src: Mapzen.com
These folks build open-source tools focused on getting the most out of OSM. Tanagram is a really awesome library for creating custom-styled, 2D and 3D basemaps using OSM data. Mapzen Turn-by-Turn and Mapzen Search are fast, free-to-use directions and geocoding tools, respectively.
"Mapbox is a mapping platform for developers. Our building blocks make it easy to integrate location into any mobile or online application." src: Mapbox.com
Mapbox provide open-source tools to build web maps from scratch, such as
MapboxGL, and tools for, geocoding, directions, and some geospatial analysis with Turf. They offer basic geodata hosting services that their tools are built to use. Mapbox Studio is an incredible cartographic design tool for creating custom basemaps using OSM and your own data.
Check out the Mapbox Studio Gallery.
To follow along, sign-up for CartoDB
Go to CartoDB.com
- you can login with your google account or
- select a username, email, and password
A Software as a Service (SaaS) cloud computing platform that provides GIS and web mapping tools for display in a web browser. CartoDB users can use the company's free platform or deploy their own instance of the open source software. CartoDB is offered as freemium service, where accounts are free up to a certain size. For larger accounts, a fee is applied. src: wikipedia
CartoDB is basically a full-stack web GIS
- PostGIS-enabled PostgreSQL database on the backend
- OSM basemaps, with default styles available and the option to link to custom basemaps from other places (e.g., Mapbox)
- great off-the-shelf geodata visualization tools
you can interact with each element in the stack through a web UI, or in some cases, programmatically via APIs
Create a new map!
If you've just created your account, you'll get a nice prompt like this:
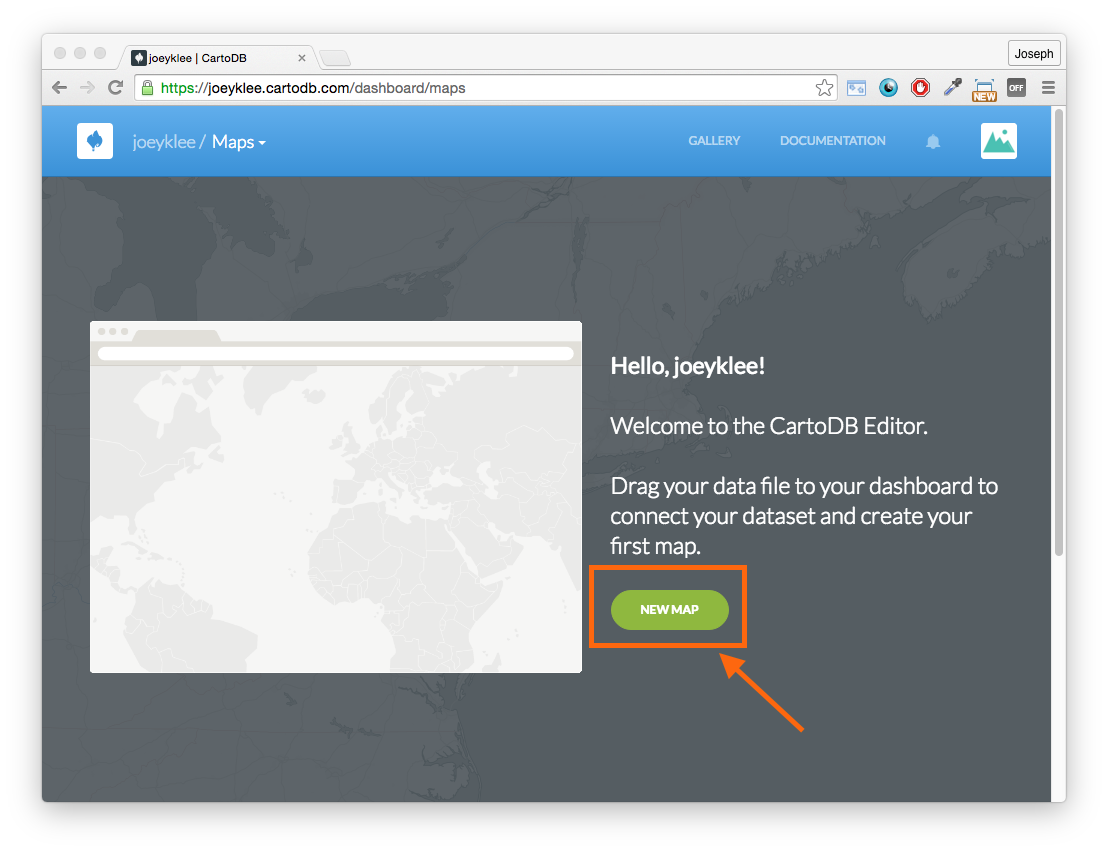
Or if you already had an account, go to your dashboard at https://{{username}}.cartodb.com/dashboard
Exploring the CartoDB Editor:
There are two basic views when working in the CartoDB Editor:
- Profile
{{username}}.cartodb.com/me
- Dashboard
{{username}}.cartodb.com/dashboard
- Datasets
{{username}}.cartodb.com/dashboard/datasets
- Maps:
{{username}}.cartodb.com/dashboard/maps
Datasets
{{username}}.cartodb.com/dashboard/datasets
Here is where you'll get a list of the datasets you have in your account as well as options to connect to public datasets from the Data Library
Maps
{{username}}.cartodb.com/dashboard/maps
Here is where you'll find previous maps you've worked on and where you can create new maps
Connect a dataset
Let's get to it by by clicking on New Dataset to gather data for our map!
You'll see numerous options to gather data for use in CartoDB.
For the free account, you can only upload static data from certain places. Paid acccounts upload data from more sources to CartoDB and also stay "linked " to the source, keeping things up-to-date.
- Navigate from
data >>> dataset >>> lawyer page >>> list of datasets
- Filter by GeoJSON
- Find something you like, and open it. Point data will be easiest for this demo.
Get a link to the selected WPRDC dataset's GeoJSON
- under Data and Resources click GeoJSON
- the url to the raw data source is at the top of the page
- copy the url
SIDEBAR: You'll notice that the WPRDC dataset page already has a map with the data! It's built with Leaflet and uses an OSM basemap from MapQuest
Back in CartoDB...
after you've clicked New Dataset:
- In the lower right text field, paste the WPRDC GeoJSON link and hit
Submit.
- Click
Connect Dataset at the bottom of the screen. You might have to do this a few times, and it may take a little while with big datasets.
Yoi! You should see a data table.
At the top of the table, we see the field titles (e.g., the_geom)and the field types, (e.g., geometry).
Here, you can change the field name, sort the data, add new columns, and more.
Different field types will have different kind of visualization options when we get to the map.
Wait... Don't I need to worry about the coordinate system?!
Our GeoJSON data from the WPRDC is already in the Web Mercator projection, so no.
Per the spec, GeoJSON uses a a geographic coordinate reference system, with a WGS84 datum, by default - same as Web Mercator.
And typically, you'll find that publishers of GeoJSON use Web Mercator, since the format is geared towards web maps.
Our data is good to go! Now let's move over to the map.
- At the top of the screen, click on
Map View. This is just a view of the data on a map, not officially a map yet.
- On the right hand side of the page we see a bunch of different options to make our map. Click around some and explore.
- SQL
- Wizards
- InfoWindow
- CartoCSS
- Legends
- Filters
Styling Data: Wizards
The first thing we can do is look at how to style our data in different ways.
On the right hand side, click on the paintbrush icon. This is the wizards panel. Play around with the different styles and suboptions -- what wizard options display what kind of information? Which kinds of wizard options don't make sense for the kind of data we have? This is where the field type comes into play -- some wizard options are only available for some field types.
Styling Data: CartoCSS
CartoCSS is a CSS-like language for cartographic styling of geodata
It's good for complex styling for static visualization of data. It's a bit less intuitive for the animated styling available in the Wizard. Styles created with the Wizard will be automatically written in CartoCSS, which you can view here.
Portions of the CartoCSS language used here are also used by Mapbox.js (though that has been superceded by the Mapbox Studio approach shown earlier)
Filtering Data: Filters and SQL
Use the Filter tool to query and filter the data you want to show on the map, Using data in one or more columns. This auto-creates a SQL statement and applies it to your data.
Or, skip the GUI and use the SQL tool to write SQL yourself. Use this for complex filters: those that require a look at multiple columns and have many conditions (e.g.: these but not those, except for those).
Pop-ups
Customize what will happen when you click on or put your mouse over one of the points of your map using the InfoWindow tool.
- Decide what fields you want to appear in your popup, and if you want it to be an on-click popup or an on-hover popup.
To get more advanced, you can switch to HTML and do some custom markup.
Adding More Data and Making a Map
If you'd like to add more data to your map, you can click the blue + button at the top of the side panel.
This will require you to make a map -- right now we are simply looking at a spatial representation of our dataset. A map is when we add another dataset to create a map layer, where we can do more styling.
Creating Your Own Data
You can also create data directly in CartoDB.
- In your map, on the upper right there's a plus sign. If the tab is expanded it says
Add New Layer.
- Click that to create a new layer.
- Then pick
Add an empty layer.
Start drawing new data
There's a circle with a plus on it at the bottom right. Click it.
It will ask you if you are adding a point, line or polygon. Points are good for specific places (stores, restaurants, bike racks, etc.), lines are good for routes (maybe bike trails or something) and polygons are best for areas -- neighborhoods, for example.
Pick which one you are adding. Remember that each layer can only be one type of data -- all points, all lines, or all polygons.
Click to add your data. For points, click once. For lines and polygons, click once for each vertex. When you're done, click the Done button.
Give your features some Attributes
We can also add attributes to our data.
Click on your feature and click the three lines, which is edit data.
It will automatically have fields for name and description.
You can also click Add new column to create more.
Give your layer a name
Make sure you change the name of your new layer too! Otherwise it will just be untitled_table which isn't very helpful.
To do that, click the menu tab to bring it out, then double click on the name of the layer to change it.
(Note that this will only rename the layer in this map. If you want to change the name of the data itself, which will help you organize your data better, click where it says View of untitled_table and change it there. )
Your new data will behave exactly like other data in CartoDB -- you can change symbology, add hover and click behavior, and more.
Adding Elements
If we haven't added extra data, we need to make this visual representation of the dataset into a map to add a title, legend, and other good map stuff. Click Visualize, and then Create Map.
If you followed along and added your own data, then you'll see the Add Element button. Use this title, description, annotation, etc.
The Options gear button at the bottom of the map lets you add other mappy-things, like a search box, fixed title bar, and map controls.
Publishing Your Map
Now our map is ready to go! We can publish this out in a few different ways: sharing links with friends, embedding it onto a web page or blog post, or adding it to another app using CartoDB.js.