
Web Map Cartography with Mapbox Studio
What is Maptime?
Today:


Today we're going to talk (mostly) about designing the Base Map
What is this Base Map thing?
Isn't it all a just web map?
Let's look at some examples.
roads, water, buildings, forests, topography, points of interest...
MapQuest: data from Open Street Map, designed using Mapbox
Freemium model software-as-a-service platform for making web maps, apps, data.
Acknowledgement: A good bit of the content shown here comes straight from Mapbox
A tool for the programmatic design of base map cartography
A way to style all of the data from Open Street Map (sort of)
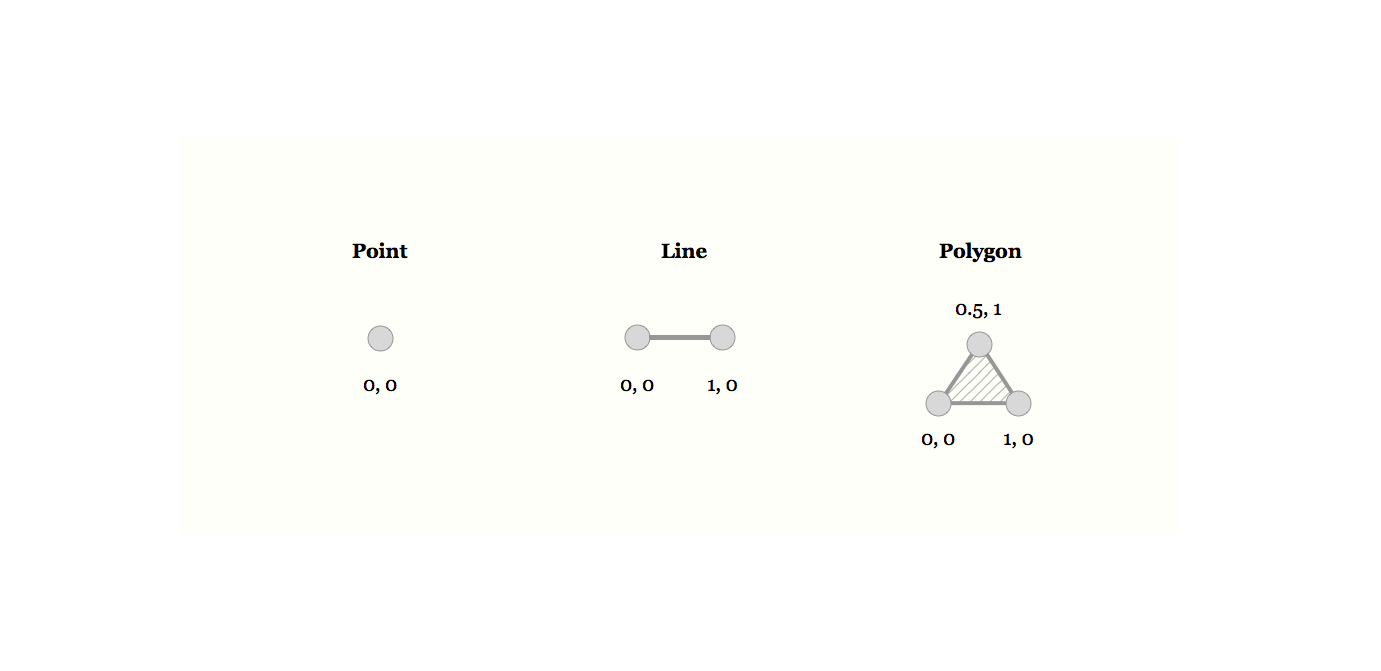
Datasets vs. Tilesets
Datasets: fully editable geographic data. The data you are telling a story about.
Tilesets: optimized for quick display of lots of geodata. The format of your base map.
We are going to talk (mostly) about tilesets today.
The base map is comprised of a tileset: many, many individual tiles.

Tiles are a super-efficient way to serve up lots of geodata.
Tiles can be served up as raster images (pictures) or vector data.

Tiles loaded are dependent on location (X and Y), and zoom (Z) of your map view.
Exponential increase in tiles per zoom level that must be stored.

Vector data are stored in tiles, but are rendered independent of zoom level.

Mapbox Studio: a way to style all the data for all the tiles at all the zoom levels


Create a new style from a template:
Styles >>> New Style >>> Basic

Styles > Layers > Data Sources
A style is made of links to many layers.
Layers are linked from a data source.

Mapbox hosts a curated version of OpenStreetMap for your use as a data source.
You can also upload your own data.
OK, let's make a custom base map
Remember: maps are communication tools
Remember: imitation is the finest form of flattery,
but give credit where credit is due
Also remember: it's easy to lie with maps,
but don't.

see raw data and compare styles

Not everything from a layer is showing all the time!?
Mapbox's curated OSM data source has some pre-applied filters. Read more here.
e.g.,: building
"Large buildings appear at zoom level 13, and all buildings are included in zoom level 14 and up."
OK! I have some data representing some theme. Should I load/style it with Mapbox Studio?
use tileset for data visualization when
(later on, use the Query Rendered Features API: accessing tileset data attrs in pop-ups)