Next meetup set for February 5!
The next Maptime Bend meetup is scheduled for Thursday, Feb. 5!
###CartoCSS 101
Rafa from MapBox is making the journey from the valley to school us all in CartoCSS and MapBox Studio.
Note: We may need to move the venue if we get a large turn out.
QGIS FTW!
What is QGIS?
QGIS (previously known as “Quantum GIS”) is a cross-platform free and open-source desktop geographic information systems (GIS) application that provides data viewing, editing, and analysis capabilities.
Licensed under the GNU General Public License
QGIS allows you to make maps and more…
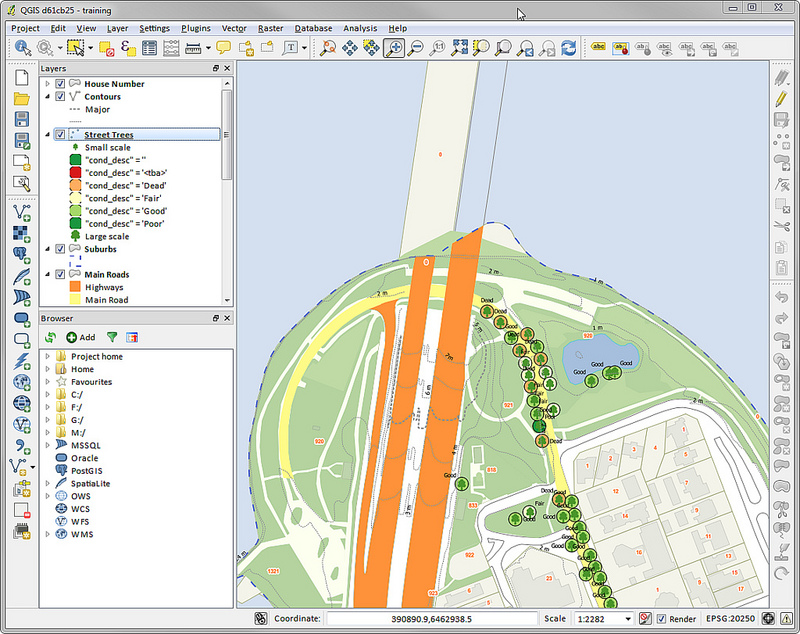
QGIS is a powerful software application that allows you to work with Geospatial data (create, read, update, and delete), create maps, visualize data, and perform rich Geospatial analysis. Below are some examples:
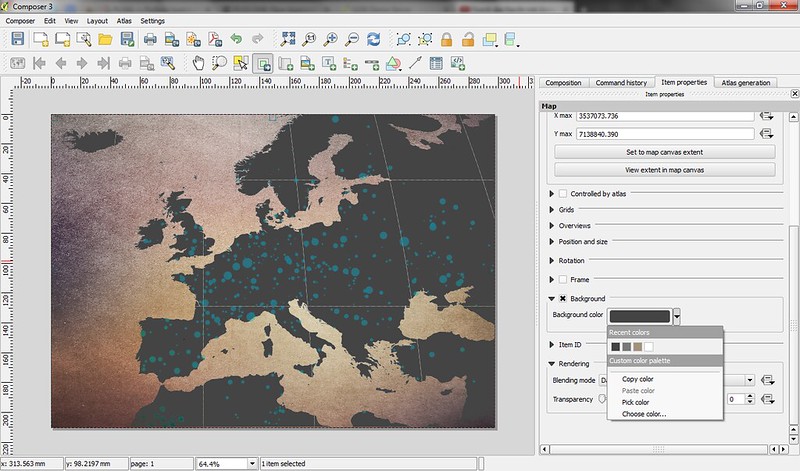
Map Cartography

Infographics
 Source: Flickr
QGIS is a Geospatial Swiss Army Knife
QGIS is a very powerful software application. With that said the product is very feature rich and is built for GIS users.

Knowing the basics of GIS will be helpful to get started If you are new to GIS I would recommend grabbing a fresh cup of coffee and reading Tom MacWright’s MapSchool. It is an EXCELLANT read to help you better understand the basics of GIS and cartography.
QGIS Components
QGIS Desktop
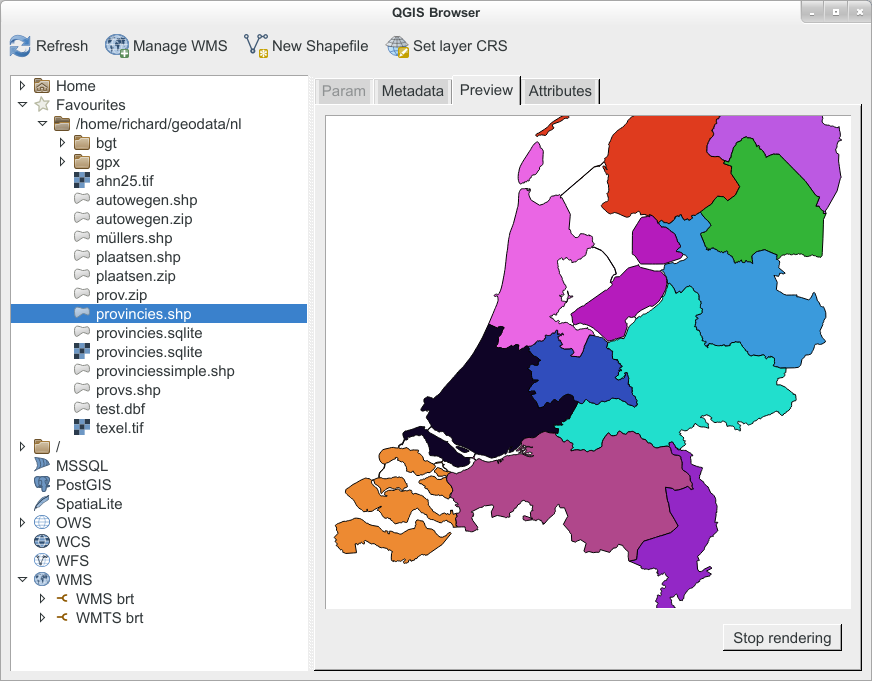
QGIS Browser
QGIS Server
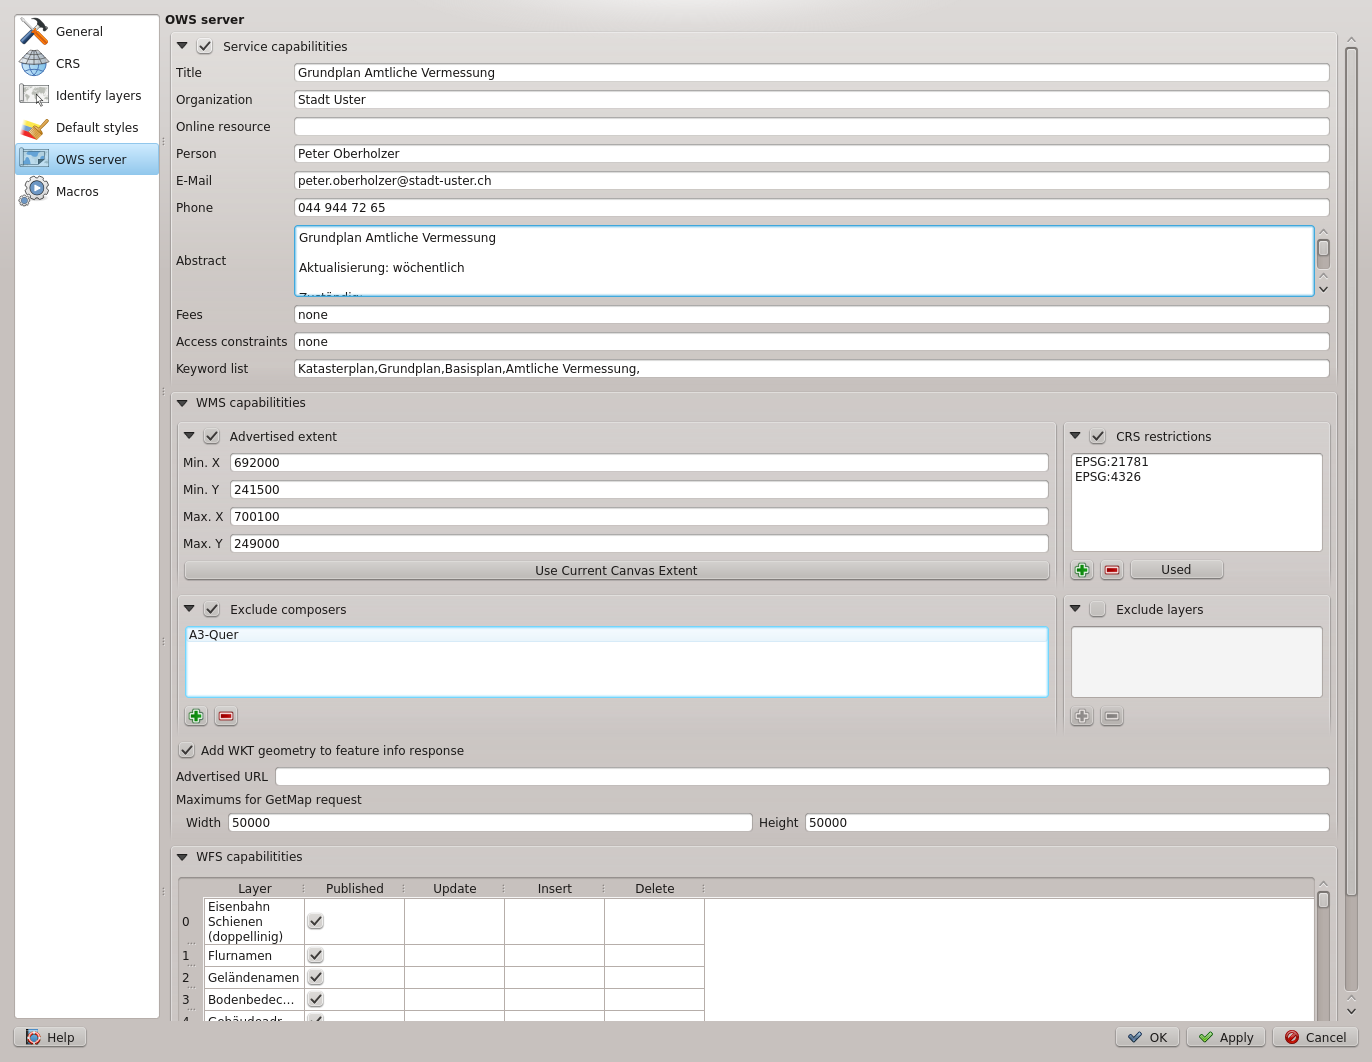
BETA QGIS Server
For this talk today we are going to focus on using the QGIS Desktop application.
Getting Started
To install QGIS go to the home page and click on the “Download Now” button.

NOTE: The file download is around 500 MB.
Once you have installed QGIS you should now have a fancy new application installed under Application or Program Files that awaits your mapping needs.

Boundless QGIS Installers
As Andy pointed out in the meetup announcement, another install route is to use the Boundless’s QGIS installers. Although their release is a couple versions behind the latest QGIS build, they include everything you’ll need to get started. Their site also requires you to enter your email address, and then they’ll email you a link to the installers. For your convenience, I’ve done that already and have linked directly to the ZIP archives here:
Windows installer: Download
Mac installer: Download
QGIS Application - UI
Let’s get familiar with the UI
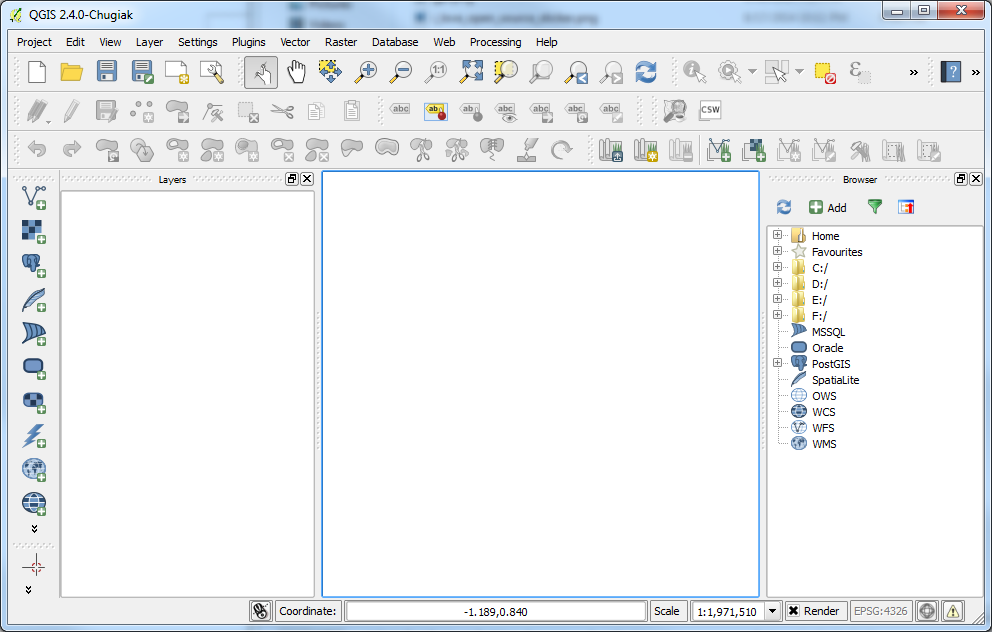
Main UI
When you first launch QGIS the application should looks similar to the screenshot below:
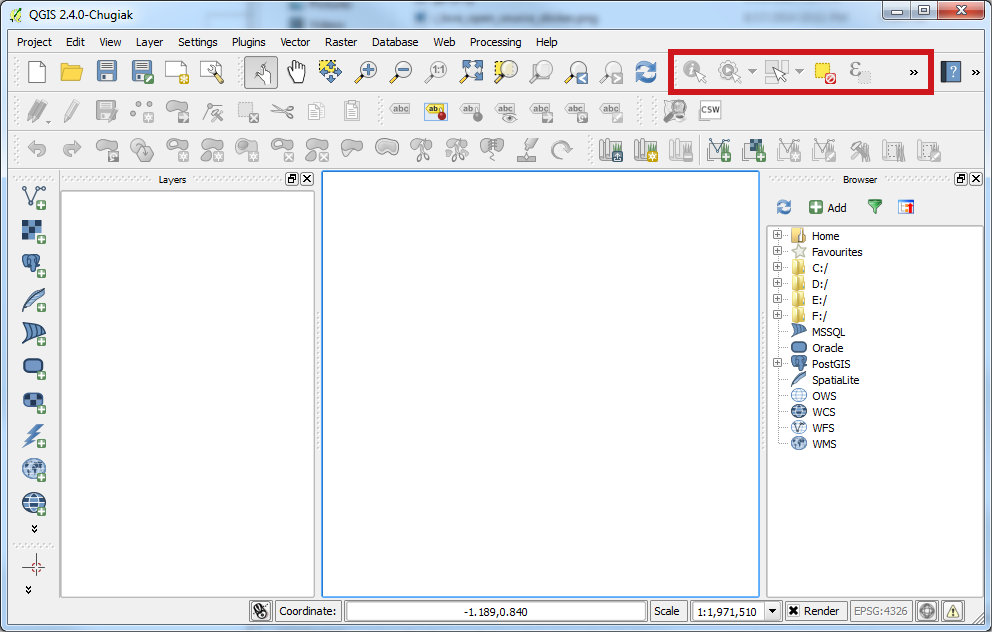
Map Navigation
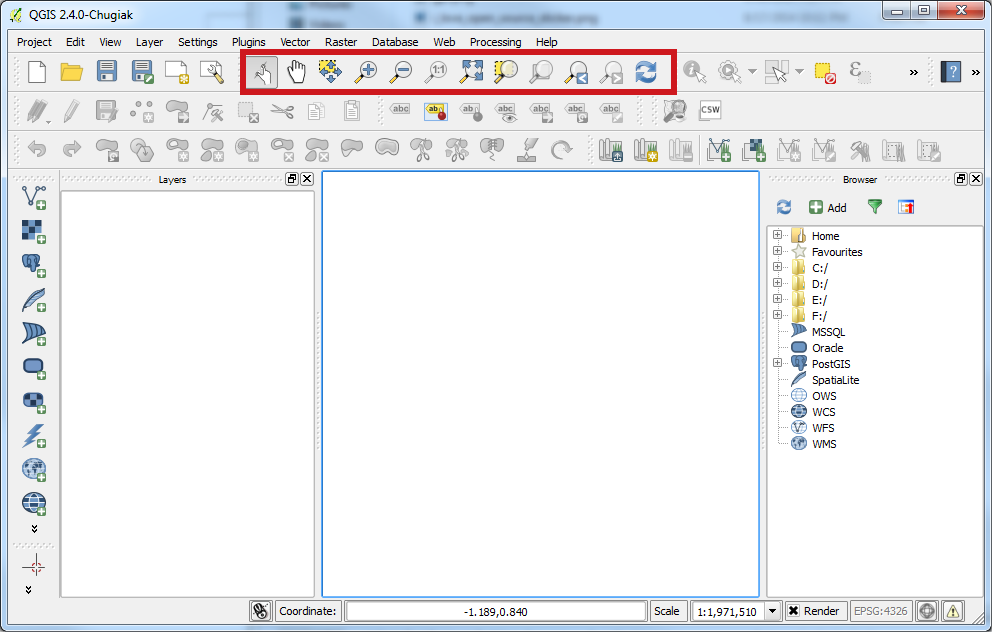
The Map Navigation tools can be accessed using the top set of tools. These tools allow you to zoom, pan, etc.
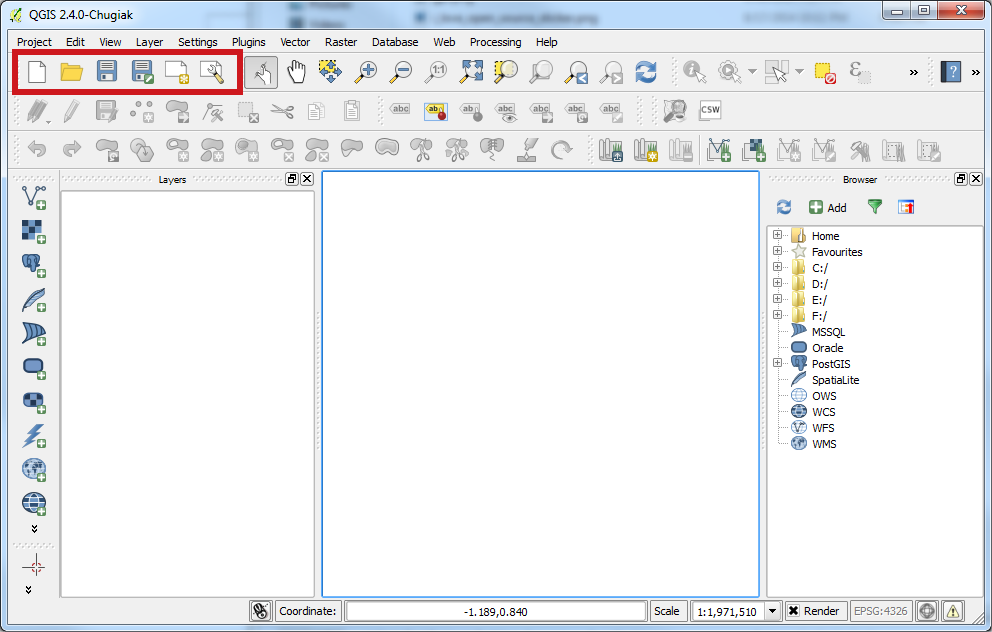
File Toolbar
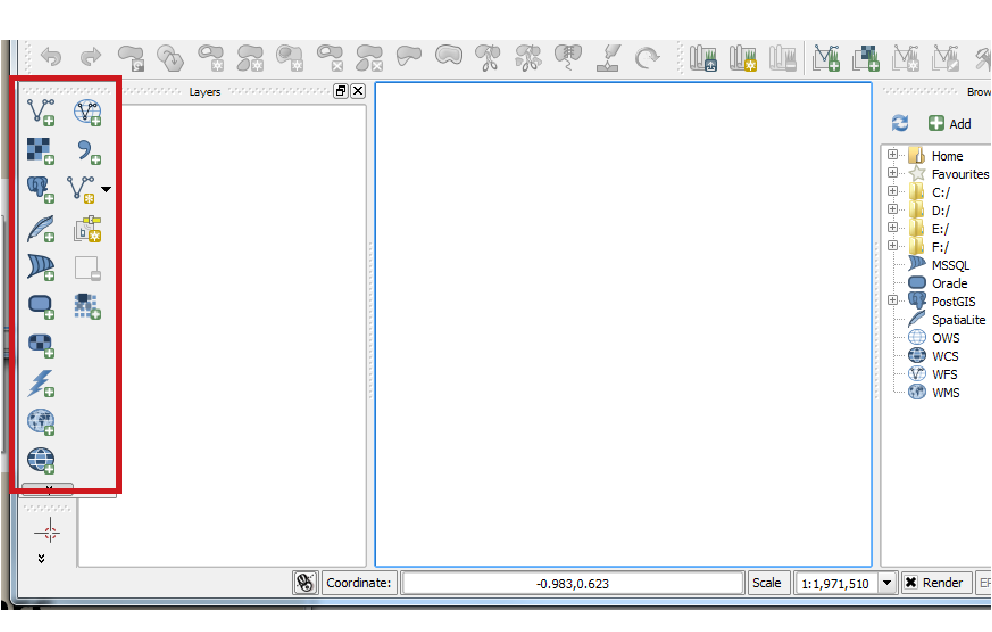
Manage Layers
Attributes Toolbar
Layers Panel
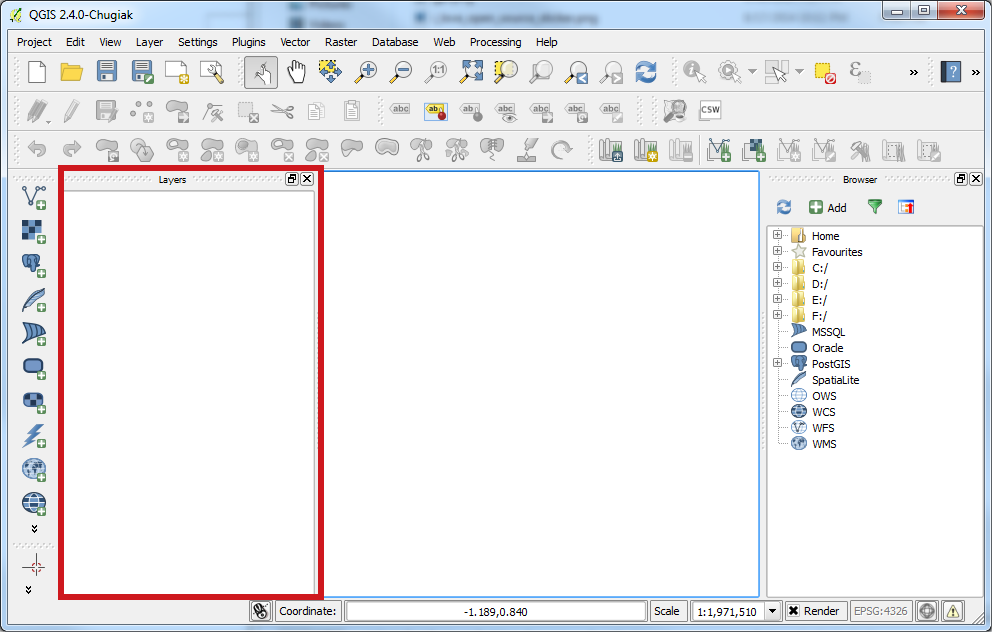
- Access and manage map layers
Browser Panel
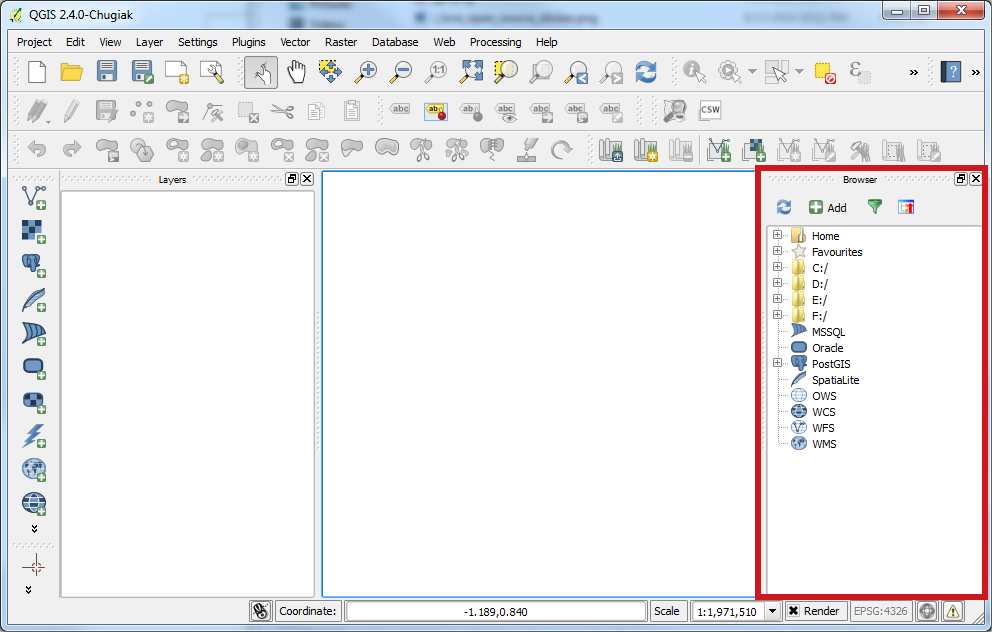
- Browse local and remote geospatial data.
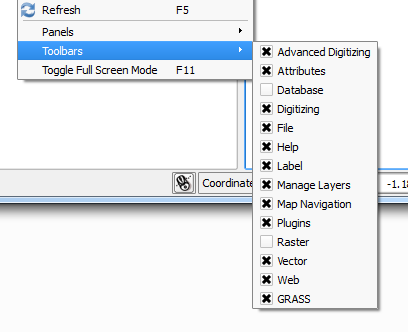
Other Panels and More
OK enough of this intro stuff. Let’s dig in and make a map.
Let’s MAKE A MAP!
Introduction
Building on top of our previous meetups I figured that we could take a deeper look into the trail data that exists here in Central Oregon.
Let’s start first with downloading some City Limit data from the Oregon State Geospatial Clearinghouse. The Oregon State Geospatial Clearinghouse is a great resource for State level Geospatial data. Local County and City data can be accessed (sometimes for $) from Deschutes County and the City of Bend.

Bend City Limits Steps to Download Our First Dataset
- Go to the Spatial Data Library Alphalist
- Download the City Limits 2013 Polygon Shapefile
- Unzip the compressed file to your local machine - you should see several files which as a whole make up a Shapefile

Add the Shapefile to QGIS
- Launch QGIS
- Click the “Add Vector Layer” button from the Data Toolbar

- Navigate to where you downloaded the City Limits shapefile and select the .shp file.

- You should see a polygon GIS layer with boundaries of Oregon City limits.

OH AWESOME! Zoom in on this data. Click the identify tool. Explore your first dataset you have added to QGIS.
Changing Symbology for our City Limits Layer I am not sure about you but I am not a fan of the mauve color QGIS randomly selected for my City Limits. In fact I really only want an outline color and no fill pattern. Let’s explore changing the symbology for our City Limits layer.
- Double click or Right Click (you WindowZ peeps) on the “citylim_2013” layer in the Map Table of Contents. A Layer Properties Dialog should appear.

- Change the Symbol Layer Type to “Outline: Simple Line”. Pick a line color to fit the mood you are in.

- I am in the mood for a DASHED line pattern

- Press Apply. Your layer symbology should have changed. You should see the beautiful shape of Bend City Limits.

Congrats we now see the lovely shape of our fair city.
OpenStreetMap Trail Data
OK. Big deal I see the City of Bend. I thought we were going to access some trail data. U BETCHA!
As we learned in our previous meetup OpenStreetMap is a treasure trove of spatial data. There are many ways to extract. Today we will try using Overpass so that we can pull in .geojson data.
- Go to the Overpass website. Overpass is amazing. Lets dig deeper.
- I want to extract all lines (known in OSM as ways) that have been tagged as a bike path.
- Zoom to Bend.
- Enter the following text to the left panel
- Run the Query and Export a GEOJSON file

- Add the .geojson file that you downloaded to your computer to QGIS. Symbolize to your heart content.
NOTE: Looks like some of the data in OSM needs to better attributed.
Let’s Add Some Imagery
One of the AMAZING features of OSM are all the User Plugins available. Plugins add extra functionality to QGIS. To complete our map we need some imagery.
- Click on the Plugins menu > Manage Plugins
- Install the OpenLayers Plugin

- Close the Plugins Dialog. You should now have a new Toolbar name “Web”
- Choose to add Microsoft’s Bing Aerial Map

- You may need to drag and drop the layers in your Layer list to move the imagery to the bottom.
ZOMG - I AM A CARTOGRAPHER
OK…Let’s make a map.
- Position the map.
- Once positioned the way you want. Go to the Project menu and choose “New Print Composer”
- Give a name for your beautiful new print composition

- A whole new Application Window should appear with a Blank Paper Canvas. This is our MAP!!!

- Click on the “Add New Map” tool and drag a rectangle representing where you want to add a new map

- WOAH we have a map. Feel free to add a title, north arrow, legend and more!

CONGRATS
YOU just made your first QGIS Map

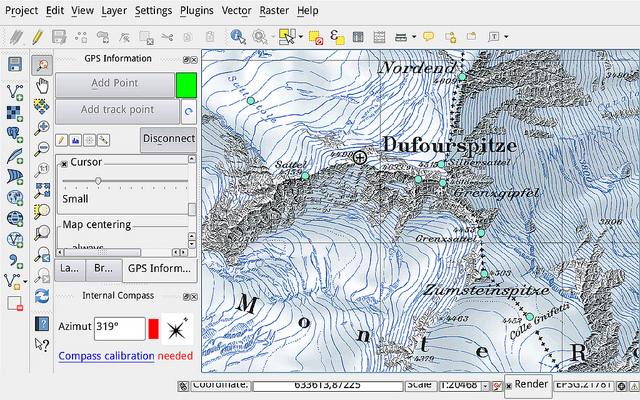
Special Thanks Thank you MapTimeBoston for your QGIS-101 tutorial Several images from this presentation are referenced in this lesson.
Next meetup set for January 7!
UPDATE 3: January’s Maptime Bend will once again be at McMenamins main pub in Bend, in the Smoke Room!
UPDATE 2: QGIS can take a while to download and install, and if we all try to do it at once on a restaurant wifi, we’ll never get it done. There will be a couple of thumb drives with installers available, but if you have time to download and install beforehand, it’ll save time for all those fancy raster algebra and spatial join demos.
There are a couple ways to install QGIS. A good way for Windows users is OSGeo4W. Unfortunately there is not a Mac version. (The “W” stands for Windows, after all.) The official installer for QGIS is here, but the Mac install requires you to install a lot of separate dependencies. (Don’t even get me started on trying to update QGIS on a Mac.)
The simplest way I’ve found is using Boundless’s QGIS installers. Although their release is a couple versions behind the latest QGIS build, they include everything you’ll need to get started. Their site also requires you to enter your email address, and then they’ll email you a link to the installers. For your convenience, I’ve done that already and have linked directly to the ZIP archives here:
Windows installer: Download
Mac installer: Download
Looking forward to seeing everyone there!
UPDATE: Moved the Maptime Bend meetup to Wednesday, Jan. 7 to avoid conflict with another popular meetup! So many meetups, so little time!
Join us on Jan. 7, 2015, as we explore QGIS, a free and open-source desktop application for creating, editing and exporting almost all types of geospatial data. More details to come!
Getting Started with OpenStreetMap Editing
What is OSM?
OpenStreetMap is a volunteer project to build a free map of the world. Started in England, it has spread globally. The United States map is functionally complete (though mapping is an endless task.)
Editing OSM data
There are several methods to edit OSM data, but the most popular are the online iD editor, and the offline JOSM editor.
This article focuses on iD.
Legal
OSM is a free map of the world. It’s HUGELY IMPORTANT that none of the data entered into the map is encumbered by copyright. NEVER, NEVER, EVER use a copyrighted source for map data, unless that source has been specifically approved by OSM itself.
You are free to trace any roads or entities that you see on the satellite view in the iD editor due to a legal agreement between OSM and Bing.
USGS maps and imagery are also free to use, as well as NPS/FS maps.
See the OSM Legal FAQ for more details.
Setup
- If you haven’t already, install a supported browser, like Chrome, Firefox, or Safari. Sorry, Internet Explorer! Just kidding. I’m not sorry. That’s karma for IE6. ;)
- Visit http://openstreetmap.org/ and create a free account. Log in.
- Scroll and zoom to a place on the map you wish to edit.
- Pull down the “Edit” menu, and select “Edit with iD”.

You’re ready to begin improving the map!
Editing Overview
You can play around in the editor all you want without impacting the live map. There’s undo/redo functionality, and everything stays local to you until you hit “Save”.
Once you hit “Save”, your data is merged into the live map data, and a re-render of the main map tiles will be queued shortly.
(Technically, it’s only the mapnik (“Standard”) layer that triggers immediately, and that only triggers after you zoom in and get the tiles again. Hit reload on the browser in the OSM area you just edited, then wait a minute and hit reload again. The new edits should show.)
Start with small edits. Don’t delete anything that you didn’t make unless you know what you’re doing. Have fun!
Adding and Editing Points and Shapes
There are three main types of things you can edit in iD: points, lines, and areas. You can select which you wish to draw with the menu at the top of the map. (Hover over the items for tooltips and keyboard shortcuts.)

Each of the items in the map database is rendered on the basis of how it is “tagged”. Tags are key/value pairs that describe what the road is. For instance, a tag might say “this line is highway=residential”, and then a renderer will know to draw it with a certain type of line. “water=stream” might be drawn with a different type of line.
Technically, there are only two things in the database: nodes and ways (which we call “points” and “lines” in iD). An area is just a line that’s connected and tagged with an area tag. However, iD differentiates lines and areas, so you need to choose the right one for what you’re drawing. E.g. lines for roads and streams, areas for city boundaries and lakes. (And when I say there are “only two things”, I actually mean there are more than that, but go ahead and pretend I didn’t lie there.)
Adding Points
A point represents a single thing. Like a bathroom (“toilets”) or a pub or a post office. Or a city.
Let’s add a new pub. For the demo, I’ll just add it to the middle of nowhere. Remember: you can always undo your changes before you Save.
First, click “Point” to add a new point, then click on the map to add it to the map. When added, it has a red outline to let you know that it is the currently-selected object.
This adds a point, but it’s not tagged. Let’s tag it as a pub. Click on “Search” on the left, and type “pub”. This brings up a list of matches. With the new point selected (red outline), click on the “Pub” entry on the left.

After clicking on “Pub”, a submenu opens in which you can give the pub attributes.
In general, all attributes are optional. In this case, we really should give it a name so people who look at the map will be able to see which pub it is.

(Let’s say you tagged it “Pub” and you wanted to change your mind. It’s a little counter-intuitive, but you can click on “Pub” again in the above image, and it will return to the search screen.)
At this point, if you were to hit “Save”, the changes would be added to the database for rendering!
That’s all there is to it!
Editing Points
If you click on a point, a context menu will pop up with additional actions you can take. For points, this is simply “Delete”.

You can move a point simply by dragging it to another place.
You can select multiple points by holding down SHIFT while you select them.
Adding Lines
Lines work basically the same way as points, with a few more bells and whistles.
Select “Line”, and draw the line out clicking a point at a time. Here I’ve found a dirt road outside of Bend, OR that’s missing from OSM data:

Double-click the last point, or hit ESCAPE to stop drawing. Now you’re at the tagging search menu again.
Now, I know from experience that this dirt road is of type “Track”. (See the “Tagging” section, below, for how to discover more tags.) Searching for “track”, and clicking “Track” will tag this line as a dirt track and bring up the track sub-attributes menu.
Remember, all the sub-attributes are optional, including the name.
Editing Lines
Similar to points, lines have a context menu when you click on them. You can straighten them, move them, delete them, and reverse them.

Reverse? You’ll notice that between the points of the lines, there are direction arrows showing which way the line is going. Usually this doesn’t matter, but it does in certain cases, e.g. streams, rivers, or one-way roads.
If you first select the line, then click on a point on a line, you’ll get a different context menu that allows you to split the line at that point:

That same submenu also allows you to uncouple crossing lines.
You can drag points of the line around:

And you can grab and drag one of the direction arrows to bisect a line at that point:

You can select multiple lines by holding down SHIFT while you select them. This will bring up another context menu that allows you to merge lines
Adding and Editing Areas
An area is just a closed line. Select the “Area” tool and click points where you want the area to be. Double-click the last point or hit ESCAPE when you’re done.
Here is a lake that hadn’t been added to the database. I traced the outline as an area, searched for “lake”, tagged it as a lake, and then selected the area to bring up the context menu:

The context menu has options to rotate the entire area, to square the corners (useful for buildings), to move it, and to form a perfect circle (useful for roundabouts).
But wait a moment… there’s an island in this lake. How do we cut that out so it doesn’t render as water?
First, add the island as an area. No need to tag it as anything. Then click the island to select it. Then, while holding SHIFT, click on the lake. Now both of them are selected, and a new context menu will show up. Hit “+” on that menu to join the areas, and the island is magically created.

iD is doing a lot of stuff behind the scenes when you do this. It’s creating another type of element called a “relation” of
type=multipolygonthat stores the relationship between the island area and lake area in the database. Relations can also be used to relate multiple roads that are all part of a scenic route. Or to relate an intersection with “right turn only”. Relations are powerful, important, and beyond the scope of this tutorial. You can do a lot of editing without ever touching them.
Tagging
Tag overview
Tags are key=value pairs that are stored in the database for a single point, line, or area. There could be zero tags, or there could be many.
The iD editor hides the key=value information from you behind its user-friendly UI, but you can see them if you select an object and then click “All tags” in the edit sidebar. This will show you the key=value pairs, and you can see how they correspond to the values entered in the UI:

You can also add and remove tags from the “All tags” interface. This is
particularly useful if you need to enter a tag that’s not exposed in the
iD UI. You can see, above, for instance, that fee=no is not in the UI.
A Note on Names
When tagging names, the general rule is to use the full name of the object, e.g. use “Northwest Milwaukee Avenue”, not “NW Milwaukee Ave”.
Which tag to use?
How do you know what to search for when tagging? What are the proper tags for a parking aisle? For a driveway? For a dirt road? For a seasonal stream? For a library? For a cliff? For a meadow?
In iD, it’s always good to search for a particular tag and see what it comes up with. If you’re tagging a dam, search for “dam”. That said, you might not know what you’re searching for. What’s a dam called where the water spills over the top across the full width of the river? (A “weir”.)
If in doubt, just tag it with your best guess. You or someone else can fix it later. 90% of the work is adding the line or area, so you will have made a valuable contribution doing that even if the tagging is wrong.
Here is the complete list of “official” OSM
features. Note that
these are listed as “key=value” pairs; for example, the first one is
aerialway=cablecar. The third column in the table tells you which
kinds of entities can take this tag: points, lines, and/or areas.
From the Features page, there will often be links to pages for specific types of tagging, e.g. mountain biking. If someone wants to render a mountain-biking-specific map, the detailed mountain biking tags will enable them to label trail difficulty, trail width, etc.
What if a road is paved then turns to dirt partway through?
Each object in the database has its own set of tags. A single line
cannot be both surface=paved and surface=unpaved at the same time.
You must split the line into two, per the Editing Lines section, above,
and tag the ends separately.
Image Layers
You can change the background of the map by clicking the “Background settings” button on the right.

If a detail is missing on one of the aerial maps, try another to see if it is there.
There are also topo maps, the mapnik standard OSM render, and “custom” if you have your own map tile server.
Under the maps, there are some overlays that you can put on top of the base map.
One of these is the “GPS traces” layer. This is maintained by MapBox and is rather old at this point. If you’re looking to trace a GPS path, you might want to use the “Local GPX file” layer.
Finally, one of the useful overlay layers is “New & Misaligned TIGER Roads”. If you have an unnamed road in OSM, or you’re tracing a road for which you don’t know the name, see if you can find it on this layer. More information in the TIGER section, below.
TIGER–US Census Maps
The US Census maintains its own set of maps, called the TIGER maps. For their purposes, geographic accuracy wasn’t particularly valuable, so the maps tended to be fairly wrong.
They’ve since made a large push to make the maps more accurate. However, there was a massive import of the old TIGER data into OSM by Dave Hanson many years ago, and so that data needed to be manually aligned to aerial photos or GPS data. For the entire US. By hand. For urban areas, this is largely complete as of 2014.
Fixing TIGER data
In this fine example, we have the Bing aerial imagery layer, as well as the new TIGER Roads layer activated. The TIGER data overlay is yellow lines, as well as large, bold street names that appear on the base map near the roads. It looks like there’s a discrepancy between the new TIGER data and what’s in OSM.

In OSM, Whaley Drive heads southwest from Sonoma Street, but TIGER has it in a different place.
Furthermore, there’s no road where the OSM data is on the aerial photo.
Does OSM have it wrong? Is the aerial photo old? Is the TIGER data wrong? How can you tell without being there?
First, select Whaley Drive and look at “All tags”. There are a ton of tags in there that clearly mark it as part of the original TIGER OSM import.

(In these modern times, imports generally do not attach all this metadata to the objects, but this was from a while ago.)
So we know the road was part of the automated TIGER import.
But has it been modified since then? Maybe someone with local knowledge we don’t have actually modified the line. For us to undo that work would be an error. How can we tell?
At the very bottom of the object tags page, there’s link that will take us to OSM to check out the details by clicking on “View on openstreetmap.org”:

When you click on that, you’ll get an OSM tab that shows more info about the line (“way”). We’re looking for if it has been edited, by whom, and when:

It looks like this is version 2, edited 4 years ago by balrog-kun. If
it hadn’t been touched yet, the only editor would have been
DaveHansenTiger. So who was balrog-kun, and what did they do?
If you look at the bottom of that column, you’ll see a “View History”
link. There we can go see what has happened with this element, and that
might help clarify the story. (Going there reveals the initial import by
DaveHansenTiger, followed the subsequent edit by balrog-kun.)
But there’s also a changeset number there at the top, 4247780. If you
click on that, it gives more details about the changeset by
balrog-kun.

The bot=yes tag is a dead giveaway that a human hasn’t been here.
Looks like the bot went through the database and expanded all the
abbreviations from the TIGER import.
At this point, I’m confident that no human has reviewed this line, and it’s very likely in the wrong place.
So I’ll select the node that joins Whaley to Sonoma, and choose “Disconnect” from the context menu. Now I can drop the endpoints of the road into the proper place between Sonoma and Viola streets. Then I click “Save”, enter a changeset description, and BAM! I’ve improved the map!
Other TIGER problems
There are some other common issues you might run into.
- Roads not aligned well with reality.
- Old roads on the map that no longer exist.
- New roads that exist but are not on the map.
- Roads that are tagged
highway=residentialwhen they’re not.
“Residential” was the import default if there wasn’t enough information
in the TIGER source to determine otherwise. One notable upshot of this
is that virtually all dirt roads in the forest are highway=residential
when they should either be highway=track or
highway=unclassified/surface=unpaved.
Using TIGER to name streets
A fairly common case is that there will be some new construction that you see on aerial photos but has not been added to OSM.
You can trace the roads, but what are their names?
Fortunately, as we’ve seen, you can just bring up the TIGER map overlay, and often find the names there. Don’t forget to use the full street name–no abbreviations!
Uploading GPS Traces
If you record a GPX file on your GPS that represents a trail or new road (or anything else that can’t easily be determined by the aerial photos), feel free to add that to the database of GPS traces.
These traces are used especially in the JOSM editor which will show the user all GPS traces uploaded to a region for all time. In iD, you’ll either have to wait until the OSM traces layer is updated (timeframe unknown), or you can take your individual GPX and show it on the map as described above.
How to upload a trace
Click “GPS Traces” at the top of the main OSM web page, then click “Upload a trace”.
The description and tags fields are for human reference and are freeform.
I suggest “Trackable” for the “Visibility”.
Once you upload the trace, you’ll get an email when it is imported.
Additional Links
Bug Tracker (Notes)
If you’re viewing (not editing) the map the website, you can click the “layers” icon on the right side of the screen. On that popup, you can check “Map Notes”.
This is the “bug tracker” for OSM. You can comment on or resolve notes that are on the map. Only resolve them if you are sure you have actually resolved it. Often local knowledge is required.
To add a new note, the “add note” icon is four icons down from the “layers” icon on the map view right sidebar.
Map Roulette
Map Roulette will give you random things to fix on the map. Some of them you’ll be able to fix, some of them you won’t be sure of and you’ll skip. If you want to pour random energy into the map, this is a good site to do it on.
Strava Slide
The elves as Strava Labs have developed a pretty fantastic tool to automatically bend lines around uploaded GPS data. And since Strava is a running/biking exercise tracking site, they have a lot of GPS data.
It’s their Slide tool, and it’s built as a hacked-up version of the iD editor.
To use, you just select a line, and then choose “Slide geometry to Strava heatmap” from the context menu that pops up.
NOTE: often the aerial photos are better for drawing trails than the GPS data. But if you can’t see the trail from the air (because of the forest, say), then the Slide tool is about the best result you can get.
If there’s just one section of a trail that needs Sliding, you can split it into its own line, then apply the Slide tool, then merge it back together with the lines it used to be attached to.
JOSM
JOSM is an offline editor, meaning you’ll download a chosen, rectangular chunk of data, edit it, and then upload it to the server later. This differs from iD, which just allows you to edit whereever you are, but requires you be online.
JOSM is a much, much more featureful and powerful editor than iD, with a correspondingly steeper learning curve, and is generally used by serious mappers. That said, I still use iD for quick fixes.
Have fun!
Reminder: Next meeting is Dec. 4
Just a reminder that the next Maptime Bend meetup is Thursday, Dec. 4 at McMenamins! RSVP with the button to the right of this post!