 Welcome to Maptime Chicago!
← and → to navigate
PLEASE interrupt if you have questions!
First things first: What is Maptime all about?
- A time for learning about maps
- Hands-on
- Beginner-focused
- Emphasis on open source, programming and web-mapping
Stolen from Lyzi DiamondOur
mission is to open the doors of cartographic possibility to anyone interested
Maptime
exists because
community,
inclusivity, and
accessibility are important components of
positive learning experiences.
Let's get down to business, shall we?
Making Your First Web Map With Leaflet!
Let's talk about web maps!
What is a web map?
First of all: A web map is a map that lives on the web.
(Duh.)
How do we put maps on the web?
HTML!
HTML is the language of websites.
Even an embedded image in a page is a web map. (But download this PDF does not a web map make.)
But when we think of web maps, we think about interactivity. We think about...
Google Maps!
I mean, right?
We want interactivity. We want people to engage with our web maps.
How do we make interactivity on the web?
JavaScript!
But let's step back and talk about how web maps work.
Lyzi also wrote a great
blog post that explains more about this stuff.
Let's talk about tiles, baby.
Raster tiles, anyway. Vector tiles some other time.
"... web maps are made up of many small, square images called tiles."
"These tiles are typically 256x256 pixels and are placed side-by-side in order to create the illusion of a very large seamless image."
All these little tiles load way faster than one big map.
This kind of map is colloquially called a slippy map.
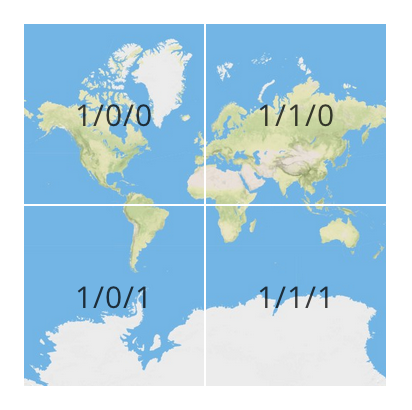
Each zoom level has its own set of tiles.
Zoom level 0: 1 tile for the world.
With each additional zoom level, the number of tiles increases exponentially.
Zoom level 1: 4 tiles for the world.
Zoom level 2: 16 tiles for the world.
... you get the idea.
Map tiles only render when you're looking at them in that moment, so tiles make maps hella fast.
As you can see, map tiles are static images on the web.
Cool. But what does this have to do with
Leaflet?
These tiles need to live somewhere on the web page. They need to know when to load and they need to react when you click or drag.
Leaflet is a JavaScript library that allows us to do just that.
Think of leaflet as one part of a web map's
anatomy.
Including JavaScript libraries in our code is like copying and pasting someone else's code into yours.
You have access to everything in that library. In our case, it's a bunch of cool tools to make web maps and give them familiar functionality.
TECHNOLOGY BREAK
If you don't already have a text editor on your computer, let's get you set up.
I will be using
Sublime Text, which should work great on any operating system. Head to that link and install the proper version.
If you are using a work computer and don't have install rights, that's okay!
Notepad on Windows or TextEdit on Mac will work fine for today.
If you're on Linux, you've probably already got this figured out.
Once you've got your text editor situation sorted, head to
this URL, which is a bit of
HTML to get you started.
Copy and paste the contents into your text editor and save it as somthing like map.html.
Got it?
The first awesome thing we can do with Leaflet is make ourselves a map container.
var map = L.map('leaflet-map');The
'leaflet-map'
in that tag refers to the
div on the page where the map is going to live.
But it's empty. We haven't added any tiles. Let's do that.
There are many
free tilesets on the web. Let's use some from
Stamen.
var map = L.map('leaflet-map').
setView([41.8947, -87.6105], 13);
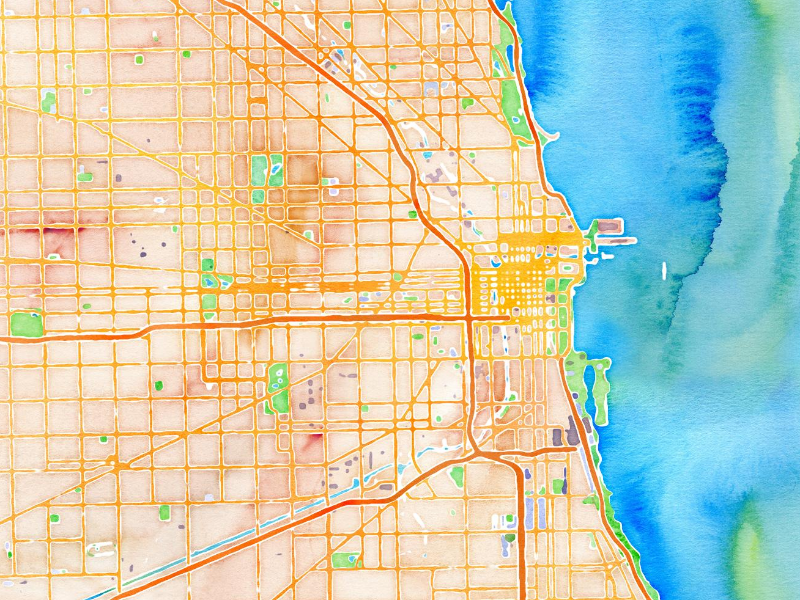
L.tileLayer('http://{s}.tile.stamen.com/watercolor/{z}/{x}/{y}.jpg').
addTo(map);We added some tiles, centered the map on The Loop, and gave it a zoom level.
As
Stephanie May would point out, what we have here is a
reference map.
A very pretty reference map with no labels, but a reference map nonetheless.
What if we want to show some data on the map? Maybe this building we're sitting in.
We can do that!
L.marker([41.885100, -87.621699]).addTo(map);
We added a map marker at the lat/lon of the hotel to the map.
Last part. Let's add a popup to the marker so when we click on it it'll tell us what it's identifying.
L.marker([41.885100, -87.621699])
.bindPopup("Maptime!").addTo(map);
We binded a popup to the marker that says Maptime!.
That's it! We made a web map!
Wasn't that so fun?!
You can do this on your own! Go forth and make web maps!
Remember: You're a champion! Keep going! You can do it!
For extra fun practice, make a
Rat Map!
The tutorial in the previous slide will guide you through the process and
the data here will make your rat map
Chicago-specific.Thanks!
My name is
Dan! I am on Twitter at
@danswick! Please come talk to me!
I like talking to people!